BP 2008 Annual Report Download - page 122
Download and view the complete annual report
Please find page 122 of the 2008 BP annual report below. You can navigate through the pages in the report by either clicking on the pages listed below, or by using the keyword search tool below to find specific information within the annual report.-
 1
1 -
2
-
3
-
4
-
5
-
6
-
7
-
8
-
9
-
10
-
11
-
12
-
13
-
14
-
15
-
16
-
17
-
18
-
19
-
20
-
21
-
22
-
23
-
24
-
25
-
26
-
27
-
28
-
29
-
30
-
31
-
32
-
33
-
34
-
35
-
36
-
37
-
38
-
39
-
40
-
41
-
42
-
43
-
44
-
45
-
46
-
47
-
48
-
49
-
50
-
51
-
52
-
53
-
54
-
55
-
56
-
57
-
58
-
59
-
60
-
61
-
62
-
63
-
64
-
65
-
66
-
67
-
68
-
69
-
70
-
71
-
72
-
73
-
74
-
75
-
76
-
77
-
78
-
79
-
80
-
81
-
82
-
83
-
84
-
85
-
86
-
87
-
88
-
89
-
90
-
91
-
92
-
93
-
94
-
95
-
96
-
97
-
98
-
99
-
100
-
101
-
102
-
103
-
104
-
105
-
106
-
107
-
108
-
109
-
110
-
111
-
 112
112 -
 113
113 -
 114
114 -
 115
115 -
 116
116 -
 117
117 -
 118
118 -
 119
119 -
 120
120 -
 121
121 -
 122
122 -
 123
123 -
 124
124 -
 125
125 -
 126
126 -
 127
127 -
 128
128 -
 129
129 -
 130
130 -
 131
131 -
 132
132 -
133
-
134
-
135
-
136
-
137
-
138
-
139
-
140
-
141
-
142
-
143
-
144
-
145
-
146
-
147
-
148
-
149
-
150
-
151
-
152
-
153
-
154
-
155
-
156
-
157
-
158
-
159
-
160
-
161
-
162
-
163
-
164
-
165
-
166
-
167
-
168
-
169
-
170
-
171
-
172
-
173
-
174
-
175
-
176
-
177
-
178
-
179
-
180
-
181
-
182
-
183
-
184
-
185
-
186
-
187
-
188
-
189
-
190
-
191
-
192
-
193
-
194
-
195
-
196
-
197
-
198
-
199
-
200
-
201
-
202
-
203
-
204
-
205
-
206
-
207
-
208
-
209
-
210
-
211
 |
 |

Financial statements
BP Annual Report and Accounts 2008
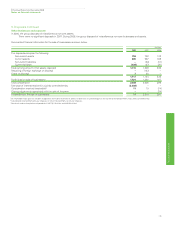
Notes on financial statements
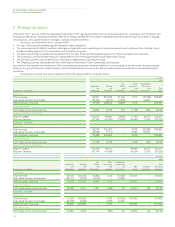
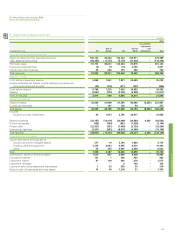
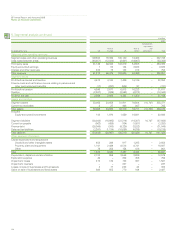
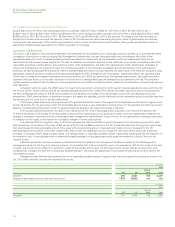
6. Segmental analysis continued
$ million
2007
Other Consolidation
Exploration Refining businesses adjustment
and and and and Total
By business Production Marketing corporate eliminations group
Sales and other operating revenues
Segment sales and other operating revenues 65,740 250,221 3,698 (35,294) 284,365
Less: sales between businesses (32,083) (1,914) (1,297) 35,294 –
Third party sales 33,657 248,307 2,401 – 284,365
Equity-accounted earnings 3,199 542 91 – 3,832
Interest and other revenues 437 134 183 – 754
Total revenues 37,293 248,983 2,675 – 288,951
Segment results
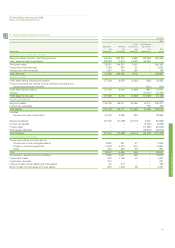
Profit (loss) before interest and taxation 27,729 6,076 (1,233) (220) 32,352
Finance costs and net finance income relating to pensions and
other post-retirement benefits – – – (741) (741)
Profit (loss) before taxation 27,729 6,076 (1,233) (961) 31,611
Taxation – – – (10,442) (10,442)
Profit (loss) for the year 27,729 6,076 (1,233) (11,403) 21,169
Assets and liabilities
Segment assets 125,736 95,311 20,595 (6,271) 235,371
Current tax receivable – – – 705 705
Total assets 125,736 95,311 20,595 (5,566) 236,076
Includes
Equity-accounted investments 16,770 5,268 654 – 22,692
Segment liabilities (37,741) (41,409) (14,074) 5,342 (87,882)
Current tax payable – – – (3,282) (3,282)
Finance debt – – – (31,045) (31,045)
Deferred tax liabilities – – – (19,215) (19,215)
Total liabilities (37,741) (41,409) (14,074) (48,200) (141,424)
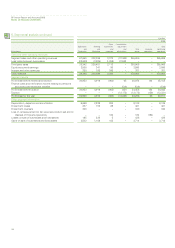
Other segment information
Capital expenditure and acquisitions
Goodwill and other intangible assets 2,245 581 27 – 2,853
Property, plant and equipment 11,539 4,474 874 – 16,887
Other 423 440 38 – 901
To t al 14,207 5,495 939 – 20,641
Depreciation, depletion and amortization 7,856 2,421 302 – 10,579
Impairment losses 292 1,186 83 – 1,561
Impairment reversals 237 – – – 237
Losses on sale of businesses and fixed assets 42 313 – – 355
Gains on sale of businesses and fixed assets 954 1,464 69 – 2,487
121