BP 2008 Annual Report Download - page 19
Download and view the complete annual report
Please find page 19 of the 2008 BP annual report below. You can navigate through the pages in the report by either clicking on the pages listed below, or by using the keyword search tool below to find specific information within the annual report.-
 1
1 -
2
-
3
-
4
-
5
-
6
-
7
-
8
-
 9
9 -
 10
10 -
 11
11 -
 12
12 -
 13
13 -
 14
14 -
 15
15 -
 16
16 -
 17
17 -
 18
18 -
 19
19 -
 20
20 -
 21
21 -
 22
22 -
 23
23 -
 24
24 -
 25
25 -
 26
26 -
 27
27 -
 28
28 -
 29
29 -
30
-
31
-
32
-
33
-
34
-
35
-
36
-
37
-
38
-
39
-
40
-
41
-
42
-
43
-
44
-
45
-
46
-
47
-
48
-
49
-
50
-
51
-
52
-
53
-
54
-
55
-
56
-
57
-
58
-
59
-
60
-
61
-
62
-
63
-
64
-
65
-
66
-
67
-
68
-
69
-
70
-
71
-
72
-
73
-
74
-
75
-
76
-
77
-
78
-
79
-
80
-
81
-
82
-
83
-
84
-
85
-
86
-
87
-
88
-
89
-
90
-
91
-
92
-
93
-
94
-
95
-
96
-
97
-
98
-
99
-
100
-
101
-
102
-
103
-
104
-
105
-
106
-
107
-
108
-
109
-
110
-
111
-
112
-
113
-
114
-
115
-
116
-
117
-
118
-
119
-
120
-
121
-
122
-
123
-
124
-
125
-
126
-
127
-
128
-
129
-
130
-
131
-
132
-
133
-
134
-
135
-
136
-
137
-
138
-
139
-
140
-
141
-
142
-
143
-
144
-
145
-
146
-
147
-
148
-
149
-
150
-
151
-
152
-
153
-
154
-
155
-
156
-
157
-
158
-
159
-
160
-
161
-
162
-
163
-
164
-
165
-
166
-
167
-
168
-
169
-
170
-
171
-
172
-
173
-
174
-
175
-
176
-
177
-
178
-
179
-
180
-
181
-
182
-
183
-
184
-
185
-
186
-
187
-
188
-
189
-
190
-
191
-
192
-
193
-
194
-
195
-
196
-
197
-
198
-
199
-
200
-
201
-
202
-
203
-
204
-
205
-
206
-
207
-
208
-
209
-
210
-
211
 |
 |

BP Annual Report and Accounts 2008
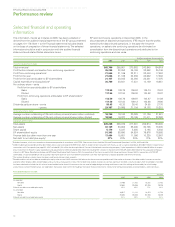
Performance review
Key statistics
$ million
2008 2007 2006
Total revenuesa 89,902 69,376 71,868
Profit before interest and tax
from continuing operationsb 37,915 27,729 30,953
Total assets 136,665 125,736 124,803
Capital expenditure and
acquisitions 22,227 14,207 13,252
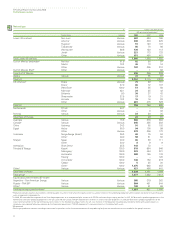
million barrels of oil equivalent
Net proved reserves – group 12,562 12,583 13,163
Net proved reserves – equity-
accounted entities 5,585 5,231 4,537
thousand barrels per day
Liquids production – group 1,263 1,304 1,351
Liquids production – equity-
accounted entities 1,138 1,110 1,124
million cubic feet per day
Natural gas production – group 7,277 7,222 7,412
Natural gas production – equity-
accounted entities 1,057 921 1,005
$ per barrel
Average BP crude oil realizationsc 95.43 69.98 61.91
Average BP NGL realizationsc 52.30 46.20 37.17
Average BP liquids realizationsc d 90.20 67.45 59.23
Average West Texas Intermediate
oil price 100.06 72.20 66.02
Average Brent oil price 97.26 72.39 65.14
$ per thousand cubic feet
Average BP natural gas realizationsc 6.00 4.53 4.72
Average BP US natural gas realizationsc 6.77 5.43 5.74
$ per million British thermal units
Average Henry Hub gas pricee 9.04 6.86 7.24
pence per therm
Average UK National Balancing
Point gas price 58.12 29.95 42.19
aIncludes sales between businesses.
bIncludes profit after interest and tax of equity-accounted entities.
cRealizations are based on sales of consolidated subsidiaries only, which excludes equity-accounted
entities.
dCrude oil and natural gas liquids.
eHenry Hub First of Month Index.
Total revenues are analysed in more detail below.
$ million
2008 2007 2006
Sales and other operating revenues 86,170 65,740 67,950
Earnings from equity-accounted
entities (after interest and tax),
interest and other revenues 3,732 3,636 3,918
89,902 69,376 71,868
Upstream activities
Exploration
The group explores for oil and natural gas under a wide range of
licensing, joint venture and other contractual agreements. We may do
this alone or, more frequently, with partners. BP acts as operator for
many of these ventures.
Our exploration and appraisal costs, excluding lease acquisitions,
in 2008 were $2,290 million, compared with $1,892 million in 2007 and
$1,765 million in 2006. These costs include exploration and appraisal
drilling expenditures, which are capitalized within intangible fixed assets,
and geological and geophysical exploration costs, which are charged to
income as incurred. Approximately 51% of 2008 exploration and appraisal
costs were directed towards appraisal activity. In 2008, we participated in
83 gross (34 net) exploration and appraisal wells in 11 countries. The
principal areas of activity were Algeria, Angola, Azerbaijan, Canada, Egypt,
the deepwater Gulf of Mexico, Libya, the North Sea and onshore US.
Total exploration expense in 2008 of $882 million (2007
$756 million and 2006 $1,045 million) included the write-off of expenses
related to unsuccessful drilling activities in Azerbaijan ($105 million),
Faeroes ($83 million), Egypt ($64 million), deepwater Gulf of Mexico
($38 million), and others ($33 million).
In 2008, we obtained upstream rights in several new tracts, which
include the following:
• In the Gulf of Mexico, we were awarded 125 blocks through the Outer
Continental Shelf Lease Sales 205, 206 and 207.
• In the US Lower 48 states, we acquired 225,000 net acres of shale
gas assets from Chesapeake Energy Corporation.
• In Canada, BP acquired three licences, covering a total of
approximately 6,000 square kilometres in the Canadian Beaufort Sea.
• In India, BP acquired one block on the East Coast in the New
Exploration Licensing Policy seventh round.
In 2008, we were involved in a number of discoveries. In most cases,
reserves bookings from these fields will depend on the results of
ongoing technical and commercial evaluations, including appraisal drilling.
Our most significant discoveries in 2008 included the following:
• In Angola, we made further discoveries in the ultra deepwater (greater
than 1,500 metres) Block 31 (BP 26.7% and operator) with the Portia
and Dione wells, bringing the total number of discoveries in Block 31
to 16.
• In Algeria, we discovered natural gas in the Tin Zaouatene-1 well in the
Bourarhet Sud Blocks 230 and 231 (BP 49% and operator).
• In Egypt, we made a discovery with the Satis (BP 50% and operator)
well.
• In the UK, we made two discoveries with the South West Foinaven
(BP 72% and operator) and the Kinnoull (BP 77% and operator) wells.
• In the deepwater Gulf of Mexico, we made two discoveries with
the Kodiak (BP 63.75% and operator) and Freedom (BP 25% and
operator) wells.
Reserves and production
Compliance
IFRS does not provide specific guidance on reserves disclosures.
BP estimates proved reserves in accordance with SEC Rule 4-10 (a) of
Regulation S-X and relevant guidance notes and letters issued by the SEC
staff. As currently required, these proved reserve estimates are based on
prices and costs as of the date the estimate is made.
On 31 December 2008, the SEC published a revised set of rules
for the estimation of reserves. These revised rules will be used for the
2009 year-end estimation of reserves, and have not been used in the
determination of reserves for year-end 2008.
By their nature, there is always some risk involved in the ultimate
development and production of reserves, including, but not limited to,
final regulatory approval, the installation of new or additional
infrastructure as well as changes in oil and gas prices, changes in
operating and development costs and the continued availability of
additional development capital.
18