BP 2008 Annual Report Download - page 138
Download and view the complete annual report
Please find page 138 of the 2008 BP annual report below. You can navigate through the pages in the report by either clicking on the pages listed below, or by using the keyword search tool below to find specific information within the annual report.-
 1
1 -
2
-
3
-
4
-
5
-
6
-
7
-
8
-
9
-
10
-
11
-
12
-
13
-
14
-
15
-
16
-
17
-
18
-
19
-
20
-
21
-
22
-
23
-
24
-
25
-
26
-
27
-
28
-
29
-
30
-
31
-
32
-
33
-
34
-
35
-
36
-
37
-
38
-
39
-
40
-
41
-
42
-
43
-
44
-
45
-
46
-
47
-
48
-
49
-
50
-
51
-
52
-
53
-
54
-
55
-
56
-
57
-
58
-
59
-
60
-
61
-
62
-
63
-
64
-
65
-
66
-
67
-
68
-
69
-
70
-
71
-
72
-
73
-
74
-
75
-
76
-
77
-
78
-
79
-
80
-
81
-
82
-
83
-
84
-
85
-
86
-
87
-
88
-
89
-
90
-
91
-
92
-
93
-
94
-
95
-
96
-
97
-
98
-
99
-
100
-
101
-
102
-
103
-
104
-
105
-
106
-
107
-
108
-
109
-
110
-
111
-
112
-
113
-
114
-
115
-
116
-
117
-
118
-
119
-
120
-
121
-
122
-
123
-
124
-
125
-
126
-
127
-
 128
128 -
 129
129 -
 130
130 -
 131
131 -
 132
132 -
 133
133 -
 134
134 -
 135
135 -
 136
136 -
 137
137 -
 138
138 -
 139
139 -
 140
140 -
 141
141 -
 142
142 -
 143
143 -
 144
144 -
 145
145 -
 146
146 -
 147
147 -
 148
148 -
149
-
150
-
151
-
152
-
153
-
154
-
155
-
156
-
157
-
158
-
159
-
160
-
161
-
162
-
163
-
164
-
165
-
166
-
167
-
168
-
169
-
170
-
171
-
172
-
173
-
174
-
175
-
176
-
177
-
178
-
179
-
180
-
181
-
182
-
183
-
184
-
185
-
186
-
187
-
188
-
189
-
190
-
191
-
192
-
193
-
194
-
195
-
196
-
197
-
198
-
199
-
200
-
201
-
202
-
203
-
204
-
205
-
206
-
207
-
208
-
209
-
210
-
211
 |
 |

Financial statements
BP Annual Report and Accounts 2008
Notes on financial statements
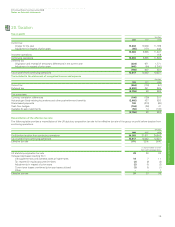
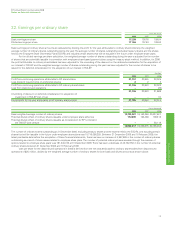
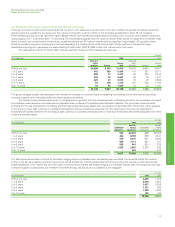
22. Earnings per ordinary share
cents per share
2008 2007 2006
Basic earnings per share 112.59 108.76 109.84
Diluted earnings per share 111.56 107.84 109.00
Basic earnings per ordinary share amounts are calculated by dividing the profit for the year attributable to ordinary shareholders by the weighted
average number of ordinary shares outstanding during the year. The average number of shares outstanding excludes treasury shares and the shares
held by the Employee Share Ownership Plans (ESOPs) and includes certain shares that will be issuable in the future under employee share plans.
For the diluted earnings per share calculation, the weighted average number of shares outstanding during the year is adjusted for the number
of shares that are potentially issuable in connection with employee share-based payment plans using the treasury stock method. In addition, for 2006
the profit attributable to ordinary shareholders has been adjusted for the unwinding of the discount on the deferred consideration for the acquisition of
our interest in TNK-BP and the weighted average number of shares outstanding during the year has been adjusted for the number of shares to be
issued for the deferred consideration for the acquisition of our interest in TNK-BP.
$ million
2008 2007 2006
Profit from continuing operations attributable to BP shareholders 21,157 20,845 22,025
Less dividend requirements on preference shares 22 2
Profit from continuing operations attributable to BP ordinary shareholders 21,155 20,843 22,023
Loss from discontinued operations –– (25)
21,155 20,843 21,998
Unwinding of discount on deferred consideration for acquisition of
investment in TNK-BP (net of tax) –– 16
Diluted profit for the year attributable to BP ordinary shareholders 21,155 20,843 22,014
shares thousand
2008 2007 2006
Basic weighted average number of ordinary shares 18,789,827 19,163,389 20,027,527
Potential dilutive effect of ordinary shares issuable under employee share schemes 172,690 163,486 109,813
Potential dilutive effect of ordinary shares issuable as consideration for BP’s interest in
the TNK-BP joint venture –– 58,118
18,962,517 19,326,875 20,195,458
The number of ordinary shares outstanding at 31 December 2008, excluding treasury shares and the shares held by the ESOPs, and including certain
shares that will be issuable in the future under employee share plans was 18,716,098,258. Between 31 December 2008 and 18 February 2009, the
latest practicable date before the completion of these financial statements, there has been an increase of 4,867,626 in the number of ordinary shares
outstanding as a result of share issues related to employee share plans. The number of potential ordinary shares issuable through the exercise of
options related to employee share plans was 191,340,183 at 31 December 2008. There has been a decrease of 42,722,753 in the number of potential
ordinary shares between 31 December 2008 and 18 February 2009.
Loss per share for the discontinued operations in 2006 is derived from the net loss attributable to ordinary shareholders from discontinued
operations of $25 million, divided by the weighted average number of ordinary shares for both basic and diluted amounts as shown above.
137