BP 2008 Annual Report Download - page 161
Download and view the complete annual report
Please find page 161 of the 2008 BP annual report below. You can navigate through the pages in the report by either clicking on the pages listed below, or by using the keyword search tool below to find specific information within the annual report.-
 1
1 -
2
-
3
-
4
-
5
-
6
-
7
-
8
-
9
-
10
-
11
-
12
-
13
-
14
-
15
-
16
-
17
-
18
-
19
-
20
-
21
-
22
-
23
-
24
-
25
-
26
-
27
-
28
-
29
-
30
-
31
-
32
-
33
-
34
-
35
-
36
-
37
-
38
-
39
-
40
-
41
-
42
-
43
-
44
-
45
-
46
-
47
-
48
-
49
-
50
-
51
-
52
-
53
-
54
-
55
-
56
-
57
-
58
-
59
-
60
-
61
-
62
-
63
-
64
-
65
-
66
-
67
-
68
-
69
-
70
-
71
-
72
-
73
-
74
-
75
-
76
-
77
-
78
-
79
-
80
-
81
-
82
-
83
-
84
-
85
-
86
-
87
-
88
-
89
-
90
-
91
-
92
-
93
-
94
-
95
-
96
-
97
-
98
-
99
-
100
-
101
-
102
-
103
-
104
-
105
-
106
-
107
-
108
-
109
-
110
-
111
-
112
-
113
-
114
-
115
-
116
-
117
-
118
-
119
-
120
-
121
-
122
-
123
-
124
-
125
-
126
-
127
-
128
-
129
-
130
-
131
-
132
-
133
-
134
-
135
-
136
-
137
-
138
-
139
-
140
-
141
-
142
-
143
-
144
-
145
-
146
-
147
-
148
-
149
-
150
-
 151
151 -
 152
152 -
 153
153 -
 154
154 -
 155
155 -
 156
156 -
 157
157 -
 158
158 -
 159
159 -
 160
160 -
 161
161 -
 162
162 -
 163
163 -
 164
164 -
 165
165 -
 166
166 -
 167
167 -
 168
168 -
 169
169 -
 170
170 -
 171
171 -
172
-
173
-
174
-
175
-
176
-
177
-
178
-
179
-
180
-
181
-
182
-
183
-
184
-
185
-
186
-
187
-
188
-
189
-
190
-
191
-
192
-
193
-
194
-
195
-
196
-
197
-
198
-
199
-
200
-
201
-
202
-
203
-
204
-
205
-
206
-
207
-
208
-
209
-
210
-
211
 |
 |

BP Annual Report and Accounts 2008
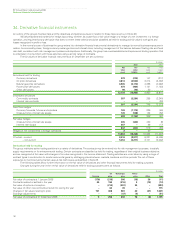
Notes on financial statements
38. Pensions and other post-retirement benefits continued
Mortality assumptions reflect best practice in the countries in which we provide pensions, and have been chosen with regard to the latest available
published tables adjusted where appropriate to reflect the experience of the group and an extrapolation of past longevity improvements into the future.
As part of the triannual valuation of our UK pensions funds, our UK mortality assumption was reviewed and updated at end-2008 resulting in an
increase in the liability of around $900 million. BP’s most substantial pension liabilities are in the UK, the US and Germany where our mortality
assumptions are as follows:
Ye a r s
Mortality assumptions UK US Germany
2008 2007 2006 2008 2007 2006 2008 2007 2006
Life expectancy at age 60 for a
male currently aged 60 25.9 24.0 23.9 24.4 24.3 24.2 23.0 22.4 22.2
Life expectancy at age 60 for a
male currently aged 40 28.9 25.1 25.0 25.9 25.8 25.8 25.9 25.3 25.2
Life expectancy at age 60 for a
female currently aged 60 28.5 26.9 26.8 26.1 26.1 26.0 27.6 27.0 26.9
Life expectancy at age 60 for a
female currently aged 40 31.4 27.9 27.8 27.0 27.0 26.9 30.3 29.7 29.6
Our assumptions for future US healthcare cost trend rate reflect the rate of actual cost increases seen in recent years for the initial trend rate, and the
ultimate trend rate reflects our long-term expectations based on past medical inflation seen over a longer period of time. The assumed future US
healthcare cost trend rate is as follows:
%
2008 2007 2006
Initial US healthcare cost trend rate 8.6 9.0 9.3
Ultimate US healthcare cost trend rate 5.0 5.0 5.0
Year in which ultimate trend rate is reached 2015 2013 2013
Pension plan assets are generally held in trusts. The primary objective of the trusts is to accumulate pools of assets sufficient to meet the obligation of
the various plans. The assets of the trusts are invested in a manner consistent with fiduciary obligations and principles that reflect current practices in
portfolio management.
A significant proportion of the assets are held in equities, owing to a higher expected level of return over the long term with an acceptable level
of risk. In order to provide reasonable assurance that no single security or type of security has an unwarranted impact on the total portfolio, the
investment portfolios are highly diversified. The long-term asset allocation policy for the major plans is as follows:
Policy range
Asset category %
Total equity 45-75
Bonds/cash 17.5-50
Property/real estate 0-10
Some of the group’s pension plans use derivative financial instruments as part of their asset mix and to manage the level of risk. The group’s main
pension plans do not invest directly in either securities or property/real estate of the company or of any subsidiary.
Return on asset assumptions reflect the group’s expectations built up by asset class and by plan. The group’s expectation is derived from
a combination of historical returns over the long term and the forecasts of market professionals. Our assumption for return on equities is based on
a long-term view, and the size of the resulting equity risk premium over government bond yields is reviewed each year for reasonableness. Our
assumption for return on bonds reflects the portfolio mix of government fixed-interest, index-linked and corporate bonds.
160