BP 2008 Annual Report Download - page 56
Download and view the complete annual report
Please find page 56 of the 2008 BP annual report below. You can navigate through the pages in the report by either clicking on the pages listed below, or by using the keyword search tool below to find specific information within the annual report.-
 1
1 -
2
-
3
-
4
-
5
-
6
-
7
-
8
-
9
-
10
-
11
-
12
-
13
-
14
-
15
-
16
-
17
-
18
-
19
-
20
-
21
-
22
-
23
-
24
-
25
-
26
-
27
-
28
-
29
-
30
-
31
-
32
-
33
-
34
-
35
-
36
-
37
-
38
-
39
-
40
-
41
-
42
-
43
-
44
-
45
-
 46
46 -
 47
47 -
 48
48 -
 49
49 -
 50
50 -
 51
51 -
 52
52 -
 53
53 -
 54
54 -
 55
55 -
 56
56 -
 57
57 -
 58
58 -
 59
59 -
 60
60 -
 61
61 -
 62
62 -
 63
63 -
 64
64 -
 65
65 -
 66
66 -
67
-
68
-
69
-
70
-
71
-
72
-
73
-
74
-
75
-
76
-
77
-
78
-
79
-
80
-
81
-
82
-
83
-
84
-
85
-
86
-
87
-
88
-
89
-
90
-
91
-
92
-
93
-
94
-
95
-
96
-
97
-
98
-
99
-
100
-
101
-
102
-
103
-
104
-
105
-
106
-
107
-
108
-
109
-
110
-
111
-
112
-
113
-
114
-
115
-
116
-
117
-
118
-
119
-
120
-
121
-
122
-
123
-
124
-
125
-
126
-
127
-
128
-
129
-
130
-
131
-
132
-
133
-
134
-
135
-
136
-
137
-
138
-
139
-
140
-
141
-
142
-
143
-
144
-
145
-
146
-
147
-
148
-
149
-
150
-
151
-
152
-
153
-
154
-
155
-
156
-
157
-
158
-
159
-
160
-
161
-
162
-
163
-
164
-
165
-
166
-
167
-
168
-
169
-
170
-
171
-
172
-
173
-
174
-
175
-
176
-
177
-
178
-
179
-
180
-
181
-
182
-
183
-
184
-
185
-
186
-
187
-
188
-
189
-
190
-
191
-
192
-
193
-
194
-
195
-
196
-
197
-
198
-
199
-
200
-
201
-
202
-
203
-
204
-
205
-
206
-
207
-
208
-
209
-
210
-
211
 |
 |

Performance review
BP Annual Report and Accounts 2008
Performance review
value accounting effects had a favourable impact of $211 million relative
to management’s measure of performance (see page 56).
During 2008, significant performance improvements in both our
Fuels Value Chains and International Businesses mitigated cost inflation
and, to a large extent, the much weaker environment. The main sources
of improvement were from restoring the revenues of our refining
operations; improved supply and trading performance; improved
marketing performance, particularly from the International Businesses,
and reduced costs. The cost reductions have been driven by the
simplification of our business structure through the establishment of
Fuels Value Chains and a reduction in our geographical footprint, as well
as by strong cost management. The most significant environmental factor
was the weaker refining environment, particularly due to lower refining
margins in the US and the adverse impact in the second half of 2008 of
prior-month pricing of domestic pipeline barrels for our US refining
system, but there were also adverse foreign exchange effects.
During 2007, the segment continued to focus on the restoration
of operations at the Texas City refinery and on investments in integrity
management throughout our refining portfolio. We have also focused on
the repair and recommissioning of the Whiting refinery following the
operational issues in March 2007. In many parts of the refining portfolio
and the other market-facing businesses, we delivered high reliability and
improved results compared with 2006. However, for the full year,
compared with 2006, the impact of the outages and recommissioning
costs at the Texas City and Whiting refineries, as well as investments in
integrity management and scheduled turnarounds throughout our refining
portfolio, cost inflation and lower results from supply optimization
decreased our result. These factors more than offset increased margins
in both refining and marketing.
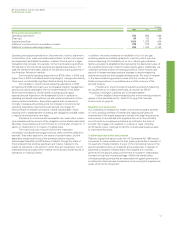
The average refining Global Indicator Margin (GIM) in 2008 was
lower than in 2007.
Refining throughputs in 2008 were 2,155mb/d, 28mb/d higher
than in 2007. Refining availability was 88.8%, six percentage points
higher than in 2007, the increase being driven primarily by improvement
at the Texas City and Whiting refineries. Marketing volumes at 3,711mb/d
were around 2.5% lower than in 2007.
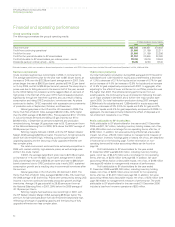
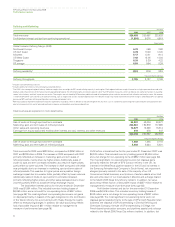
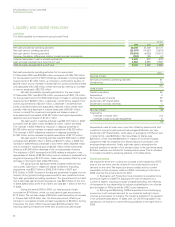
Other businesses and corporate
$ million
2008 2007 2006
Total revenuesa 5,040 3,972 3,703
Profit (loss) before interest and tax
from continuing operationsb (1,258) (1,233) (779)
aIncludes sales between businesses.
bIncludes profit after interest and tax of equity-accounted entities.
Other businesses and corporate comprises the Alternative Energy
business, Shipping, the group’s aluminium asset, Treasury (which includes
all the group’s cash, cash equivalents), and corporate activities worldwide.
The loss before interest and tax for the year ended 31 December
2008 was $1,258 million and included inventory holding losses of
$35 million and a net charge for non-operating items of $633 million
(see page 56).
The loss before interest and tax for the year ended 31 December
2007 was $1,233 million and included inventory holding losses of
$24 million and a net charge for non-operating items of $262 million
(see page 56).
The loss before interest and tax for the year ended 31 December
2006 was $779 million and included inventory holding gains of
$62 million and a net charge for non-operating items of $72 million
(see page 56).
Non-operating items
Non-operating items are charges and credits that BP discloses separately
because it considers such disclosures to be meaningful and relevant to
investors. The main categories of non-operating items in the periods
presented are: impairments; gains or losses on sale of fixed assets and
the sale of businesses; environmental remediation; restructuring,
integration and rationalization costs; and changes in the fair value of
embedded derivatives. These disclosures are provided in order to enable
investors better to understand and evaluate the group’s financial
performance. An analysis of non-operating items is shown on page 56.
Non-GAAP information on fair value accounting effects
BP uses derivative instruments to manage the economic exposure
relating to inventories above normal operating requirements of crude oil,
natural gas and petroleum products as well as certain contracts to supply
physical volumes at future dates. Under IFRS, these inventories and
contracts are recorded at historic cost and on an accruals basis
respectively. The related derivative instruments, however, are required
to be recorded at fair value with gains and losses recognized in income
because hedge accounting is either not permitted or not followed,
principally due to the impracticality of effectiveness testing requirements.
Therefore, measurement differences in relation to recognition of gains
and losses occur. Gains and losses on these inventories and contracts
are not recognized until the commodity is sold in a subsequent
accounting period. Gains and losses on the related derivative commodity
contracts are recognized in the income statement from the time the
derivative commodity contract is entered into on a fair value basis using
forward prices consistent with the contract maturity.
IFRS requires that inventory held for trading be recorded at its
fair value using period end spot prices whereas any related derivative
commodity instruments are required to be recorded at values based on
forward prices consistent with the contract maturity. Depending on
market conditions, these forward prices can be either higher or lower
than spot prices resulting in measurement differences.
BP enters into contracts for pipelines and storage capacity that,
under IFRS, are recorded on an accruals basis. These contracts are risk-
managed using a variety of derivative instruments that are fair valued
under IFRS. This results in measurement differences in relation to
recognition of gains and losses.
The way that BP manages the economic exposures described
above, and measures performance internally, differs from the way these
activities are measured under IFRS. BP calculates this difference by
comparing the IFRS result with management’s internal measure of
performance, under which the inventory and the supply and capacity
contracts in question are valued based on fair value using relevant
forward prices prevailing at the end of the period. We believe that
disclosing management’s estimate of this difference provides useful
information for investors because it enables investors to see the
economic effect of these activities as a whole. The impacts of fair value
accounting effects, relative to management’s internal measure of
performance, are shown in the table below and on the following page.
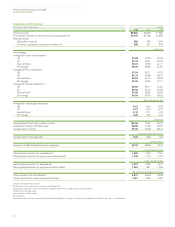
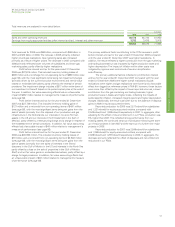
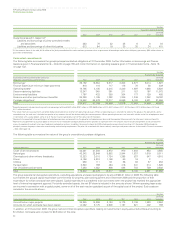
Reconciliation of non-GAAP information
Exploration and Production
$ million
2008 2007 2006
Profit before interest and tax adjusted
for fair value accounting effects 38,197 27,681 39,985
Impact of fair value accounting effects (282) 48 (32)
Profit before interest and tax 37,915 27,729 39,953
Refining and Marketing
Profit before interest and tax adjusted
for fair value accounting effects (2,395) 6,433 4,708
Impact of fair value accounting effects 511 (357) 211
Profit before interest and tax (1,884) 6,076 4,919
55