BP 2008 Annual Report Download - page 23
Download and view the complete annual report
Please find page 23 of the 2008 BP annual report below. You can navigate through the pages in the report by either clicking on the pages listed below, or by using the keyword search tool below to find specific information within the annual report.-
 1
1 -
2
-
3
-
4
-
5
-
6
-
7
-
8
-
9
-
10
-
11
-
12
-
 13
13 -
 14
14 -
 15
15 -
 16
16 -
 17
17 -
 18
18 -
 19
19 -
 20
20 -
 21
21 -
 22
22 -
 23
23 -
 24
24 -
 25
25 -
 26
26 -
 27
27 -
 28
28 -
 29
29 -
 30
30 -
 31
31 -
 32
32 -
 33
33 -
34
-
35
-
36
-
37
-
38
-
39
-
40
-
41
-
42
-
43
-
44
-
45
-
46
-
47
-
48
-
49
-
50
-
51
-
52
-
53
-
54
-
55
-
56
-
57
-
58
-
59
-
60
-
61
-
62
-
63
-
64
-
65
-
66
-
67
-
68
-
69
-
70
-
71
-
72
-
73
-
74
-
75
-
76
-
77
-
78
-
79
-
80
-
81
-
82
-
83
-
84
-
85
-
86
-
87
-
88
-
89
-
90
-
91
-
92
-
93
-
94
-
95
-
96
-
97
-
98
-
99
-
100
-
101
-
102
-
103
-
104
-
105
-
106
-
107
-
108
-
109
-
110
-
111
-
112
-
113
-
114
-
115
-
116
-
117
-
118
-
119
-
120
-
121
-
122
-
123
-
124
-
125
-
126
-
127
-
128
-
129
-
130
-
131
-
132
-
133
-
134
-
135
-
136
-
137
-
138
-
139
-
140
-
141
-
142
-
143
-
144
-
145
-
146
-
147
-
148
-
149
-
150
-
151
-
152
-
153
-
154
-
155
-
156
-
157
-
158
-
159
-
160
-
161
-
162
-
163
-
164
-
165
-
166
-
167
-
168
-
169
-
170
-
171
-
172
-
173
-
174
-
175
-
176
-
177
-
178
-
179
-
180
-
181
-
182
-
183
-
184
-
185
-
186
-
187
-
188
-
189
-
190
-
191
-
192
-
193
-
194
-
195
-
196
-
197
-
198
-
199
-
200
-
201
-
202
-
203
-
204
-
205
-
206
-
207
-
208
-
209
-
210
-
211
 |
 |

66
23
33
9
BP Annual Report and Accounts 2008
Performance review
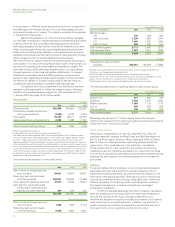
Natural gas
% million cubic feet per day
BP net share of productiona
Field or Area Interest 2008 2007 2006
Lower 48 onshorebSan JuancVarious 682 694 765
ArkomacVarious 240 204 225
HugotoncVarious 91 123 137
TuscaloosacVarious 65 78 86
Wamsutterc66.6 136 120 113
JonahcVarious 221 173 133
Other Various 451 458 461
Total Lower 48 onshore 1,886 1,850 1,920
Gulf of Mexico deepwaterbNa Kikac51.9 62 50 97
Marlinc78.2 46 13 16
Other Various 122 205 210
Gulf of Mexico ShelfbOther Various –1
Total Gulf of Mexico 230 269 389
Alaska Various Various 41 55 67
Total US 2,157 2,174 2,376
UK offshorebBraes Various 75 69 101
Brucec37.0 65 72 107
West Solec100.0 51 55 56
Marnockc62.1 24 25 42
Britannia 9.0 30 37 42
Shearwater 27.5 17 19 31
Armada 18.2 16 16 28
Other Various 481 475 529
Total UK 759 768 936
NetherlandsbP/18-2 48.7 ––
Other Various –3
Norway Various Various 23 26 35
Total Rest of Europe 23 29 91
Australia Various 15.8 380 376 364
CanadabVariouscVarious 245 255 282
China Yachengc34.3 91 85 102
Egypt Ha’pyc50.0 94 108 99
Other Various 278 206 172
Indonesia Sanga-Sanga (direct)c26.3 69 75 84
Otherc46.0 98 81 80
Sharjah Sajaac40.0 65 83 111
Other 40.0 89
Azerbaijan Shah Denizc25.5 143 73 –
Trinidad & Tobago Kapokc100.0 619 984 946
Mahoganyc100.0 323 454 321
Amherstiac100.0 288 155 176
Parangc100.0 –– 120
Immortellec100.0 136 153 219
Cassiac100.0 525 30
Otherc100.0 1,075 663 453
OtherbVarious Various 421 466 441
Total Rest of World 4,338 4,251 4,009
Total groupd7,277 7,222 7,412
Equity-accounted entities (BP share)
Argentina – Pan American Energy Various Various 385 379 362
Russia – TNK-BPbVarious Various 564 451 544
OtherbVarious Various 108 91 99
Total equity-accounted entitiesd1,057 921 1,005
aProduction excludes royalties due to others whether payable in cash or in kind where the royalty owner has a direct interest in the underlying production and the option and ability to make lifting and
sales arrangements independently.
bIn 2008, BP concluded the migration of the Cerro Negro operations to an incorporated joint venture with PDVSA while retaining its equity position. In 2007, BP divested its producing properties in the
Netherlands and some producing properties in the US Lower 48 and Canada. TNK-BP disposed of its interests in several non-core properties. In 2006, BP divested its producing properties on the
Outer Continental Shelf of the Gulf of Mexico and its interest in the Statfjord oil and gas field in the UK. Our interests in the Boqueron, Desarollo Zulia Occidental (DZO) and Jusepin projects in
Venezuela were reduced following a decision by the Venezuelan government. TNK-BP disposed of its non-core interests in the Udmurtneft assets.
cBP-operated.
dNatural gas production volumes exclude gas consumed in operations within the lease boundaries of the producing field, but the related reserves are included in the group’s reserves.
22