BP 2008 Annual Report Download - page 54
Download and view the complete annual report
Please find page 54 of the 2008 BP annual report below. You can navigate through the pages in the report by either clicking on the pages listed below, or by using the keyword search tool below to find specific information within the annual report.-
 1
1 -
2
-
3
-
4
-
5
-
6
-
7
-
8
-
9
-
10
-
11
-
12
-
13
-
14
-
15
-
16
-
17
-
18
-
19
-
20
-
21
-
22
-
23
-
24
-
25
-
26
-
27
-
28
-
29
-
30
-
31
-
32
-
33
-
34
-
35
-
36
-
37
-
38
-
39
-
40
-
41
-
42
-
43
-
 44
44 -
 45
45 -
 46
46 -
 47
47 -
 48
48 -
 49
49 -
 50
50 -
 51
51 -
 52
52 -
 53
53 -
 54
54 -
 55
55 -
 56
56 -
 57
57 -
 58
58 -
 59
59 -
 60
60 -
 61
61 -
 62
62 -
 63
63 -
 64
64 -
65
-
66
-
67
-
68
-
69
-
70
-
71
-
72
-
73
-
74
-
75
-
76
-
77
-
78
-
79
-
80
-
81
-
82
-
83
-
84
-
85
-
86
-
87
-
88
-
89
-
90
-
91
-
92
-
93
-
94
-
95
-
96
-
97
-
98
-
99
-
100
-
101
-
102
-
103
-
104
-
105
-
106
-
107
-
108
-
109
-
110
-
111
-
112
-
113
-
114
-
115
-
116
-
117
-
118
-
119
-
120
-
121
-
122
-
123
-
124
-
125
-
126
-
127
-
128
-
129
-
130
-
131
-
132
-
133
-
134
-
135
-
136
-
137
-
138
-
139
-
140
-
141
-
142
-
143
-
144
-
145
-
146
-
147
-
148
-
149
-
150
-
151
-
152
-
153
-
154
-
155
-
156
-
157
-
158
-
159
-
160
-
161
-
162
-
163
-
164
-
165
-
166
-
167
-
168
-
169
-
170
-
171
-
172
-
173
-
174
-
175
-
176
-
177
-
178
-
179
-
180
-
181
-
182
-
183
-
184
-
185
-
186
-
187
-
188
-
189
-
190
-
191
-
192
-
193
-
194
-
195
-
196
-
197
-
198
-
199
-
200
-
201
-
202
-
203
-
204
-
205
-
206
-
207
-
208
-
209
-
210
-
211
 |
 |

BP Annual Report and Accounts 2008
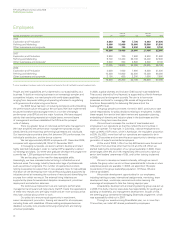
Performance review
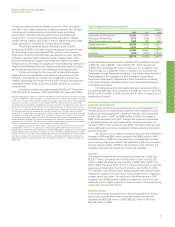
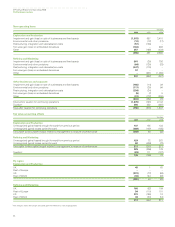
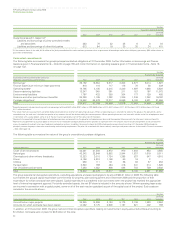
Total revenues are analysed in more detail below.
$ million
2008 2007 2006
Sales and other operating revenues 86,170 65,740 67,950
Earnings from equity-accounted entities (after interest and tax), interest and other revenues 3,732 3,636 3,918
89,902 69,376 71,868
Total revenues for 2008 were $90 billion, compared with $69 billion in
2007 and $72 billion in 2006. The increase in 2008 primarily reflected
higher oil and gas realizations. Gas marketing sales also increased
primarily as a result of higher prices. The decrease in 2007 compared with
2006 primarily reflected lower volumes of subsidiaries and lower gas
marketing sales, partly offset by higher realizations.
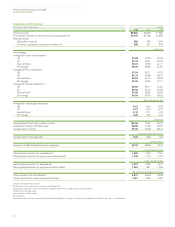
Profit before interest and tax for the year ended 31 December
2008 was $37,915 million. This included inventory holding losses of
$393 million and a net charge for non-operating items of $990 million (see
page 56), with the most significant items being net impairment charges
(primarily driven by the current low price environment) and net fair value
losses on embedded derivatives, partly offset by the reversal of certain
provisions. The impairment charge includes a $517 million write-down of
our investment in Rosneft based on its quoted market price at the end of
the year. In addition, fair value accounting effects had an unfavourable
impact of $282 million relative to management’s measure of performance
(see page 56).
Profit before interest and tax for the year ended 31 December
2007 was $27,729 million. This included inventory holding gains of
$127 million and a net credit from non-operating items of $491 million
(see page 56), with the most significant items being net gains from the
sale of assets (primarily from the disposal of our production and gas
infrastructure in the Netherlands, our interests in non-core Permian
assets in the US and our interests in the Entrada field in the Gulf of
Mexico), partly offset by a restructuring charge and a charge in respect of
the reassessment of certain provisions. In addition, fair value accounting
effects had a favourable impact of $48 million relative to management’s
measure of performance (see page 56).
Profit before interest and tax for the year ended 31 December
2006 was $30,953 million. This included inventory holding losses of
$73 million and a net credit from non-operating items of $2,563 million
(see page 56), with the most significant items being net gains from the
sale of assets (primarily from the sales of interests in the Shenzi
discovery in the Gulf of Mexico in the US and interests in the North Sea
partly offset by a loss on the sale of properties in the Gulf of Mexico
Shelf) and net fair value gains on embedded derivatives, partly offset by a
charge for legal provisions. In addition, fair value accounting effects had
an unfavourable impact of $32 million relative to management’s measure
of performance (see page 56).
The primary additional factor contributing to the 37% increase in profit
before interest and tax for the year ended 31 December 2008 compared
with the year ended 31 December 2007 was higher realizations. In
addition, the result reflected a higher contribution from the gas marketing
and trading business but was impacted by higher production taxes and
higher depreciation. The impact of inflation within other costs was
mitigated by rigorous cost control and a focus on simplification
and efficiency.
The primary additional factors reflected in profit before interest
and tax for the year ended 31 December 2007 compared with the year
ended 31 December 2006 were higher overall realizations (liquids
realizations were higher and gas realizations were lower) and a favourable
effect from lagged tax reference prices in TNK-BP; however, these factors
were more than offset by the impact of lower reported volumes, a lower
contribution from the gas marketing and trading business, higher
production taxes in Alaska and higher costs, reflecting the impacts of
sector-specific inflation, increased integrity spend and higher depreciation
charges. Additionally, the result was lower due to the absence of disposal
gains in 2006 in equity-accounted entities.
Reported production for 2008 was 2,517mboe/d for subsidiaries
and 1,321mboe/d for equity-accounted entities, compared with
2,549mboe/d and 1,269mboe/d respectively in 2007. In aggregate, after
adjusting for the effect of lower entitlement in our PSAs, production was
5% higher than 2007. This reflected strong performance from our
existing assets, the continued ramp-up of production following the start-
up of major projects in late-2007 and the start-up of a further nine major
projects in 2008.
Reported production for 2007 was 2,549mboe/d for subsidiaries
and 1,269mboe/d for equity-accounted entities, compared with
2,629mboe/d and 1,297mboe/d respectively in 2006. In aggregate, the
decrease primarily reflected the effect of disposals and net entitlement
reductions in our PSAs.
Performance review
53