BP 2008 Annual Report Download - page 117
Download and view the complete annual report
Please find page 117 of the 2008 BP annual report below. You can navigate through the pages in the report by either clicking on the pages listed below, or by using the keyword search tool below to find specific information within the annual report.-
 1
1 -
2
-
3
-
4
-
5
-
6
-
7
-
8
-
9
-
10
-
11
-
12
-
13
-
14
-
15
-
16
-
17
-
18
-
19
-
20
-
21
-
22
-
23
-
24
-
25
-
26
-
27
-
28
-
29
-
30
-
31
-
32
-
33
-
34
-
35
-
36
-
37
-
38
-
39
-
40
-
41
-
42
-
43
-
44
-
45
-
46
-
47
-
48
-
49
-
50
-
51
-
52
-
53
-
54
-
55
-
56
-
57
-
58
-
59
-
60
-
61
-
62
-
63
-
64
-
65
-
66
-
67
-
68
-
69
-
70
-
71
-
72
-
73
-
74
-
75
-
76
-
77
-
78
-
79
-
80
-
81
-
82
-
83
-
84
-
85
-
86
-
87
-
88
-
89
-
90
-
91
-
92
-
93
-
94
-
95
-
96
-
97
-
98
-
99
-
100
-
101
-
102
-
103
-
104
-
105
-
106
-
 107
107 -
 108
108 -
 109
109 -
 110
110 -
 111
111 -
 112
112 -
 113
113 -
 114
114 -
 115
115 -
 116
116 -
 117
117 -
 118
118 -
 119
119 -
 120
120 -
 121
121 -
 122
122 -
 123
123 -
 124
124 -
 125
125 -
 126
126 -
 127
127 -
128
-
129
-
130
-
131
-
132
-
133
-
134
-
135
-
136
-
137
-
138
-
139
-
140
-
141
-
142
-
143
-
144
-
145
-
146
-
147
-
148
-
149
-
150
-
151
-
152
-
153
-
154
-
155
-
156
-
157
-
158
-
159
-
160
-
161
-
162
-
163
-
164
-
165
-
166
-
167
-
168
-
169
-
170
-
171
-
172
-
173
-
174
-
175
-
176
-
177
-
178
-
179
-
180
-
181
-
182
-
183
-
184
-
185
-
186
-
187
-
188
-
189
-
190
-
191
-
192
-
193
-
194
-
195
-
196
-
197
-
198
-
199
-
200
-
201
-
202
-
203
-
204
-
205
-
206
-
207
-
208
-
209
-
210
-
211
 |
 |

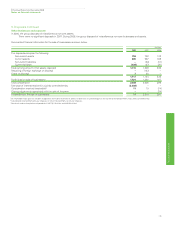
BP Annual Report and Accounts 2008
Notes on financial statements
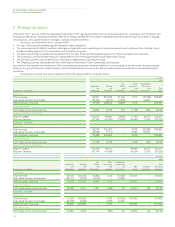
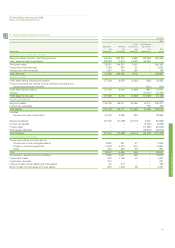
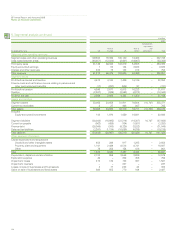
2. Resegmentation
With effect from 1 January 2008 the organizational structure of BP has been simplified into two business segments – Exploration and Production and
Refining and Marketing. A separate business, Alternative Energy, handles BP’s low-carbon businesses and future growth options outside oil and gas,
including solar, wind, gas-fired power, hydrogen, biofuels and coal conversion.
As a result, and with effect from 1 January 2008:
• The Gas, Power and Renewables segment ceased to report separately.
• The natural gas liquids (NGLs), liquefied natural gas and gas and power marketing and trading businesses were transferred from the Gas, Power
and Renewables segment to the Exploration and Production segment.
• The Alternative Energy business was transferred from the Gas, Power and Renewables segment to Other businesses and corporate.
• The Emerging Consumers Marketing Unit was transferred from Refining and Marketing to Alternative Energy.
• The Biofuels business was transferred from Refining and Marketing to Alternative Energy.
• The Shipping business was transferred from Refining and Marketing to Other businesses and corporate.
As a result of the transfers identified above, Other businesses and corporate has been redefined. It now consists of the Alternative Energy business,
Shipping, the group’s aluminium asset, Treasury (which includes interest income on the group’s cash and cash equivalents) and corporate activities
worldwide.
Comparative amounts have been restated to reflect the resegmentation, as shown below.
$ million
2007
Gas, Other Consolidation
Exploration Refining Power businesses adjustment
and and and and and Total
By business – as reported Production Marketing Renewables corporate eliminations group
Revenues
Total revenues 57,941 251,538 21,725 1,010 (43,263) 288,951
Less: sales between businesses (38,803) (2,024) (2,436) – 43,263 –
Total third party revenues 19,138 249,514 19,289 1,010 – 288,951
Segment results
Profit (loss) before interest and tax 26,938 6,072 674 (1,128) (204) 32,352
Segment assets and liabilities
Segment assets 108,874 95,691 19,889 17,188 (6,271) 235,371
Segment liabilities (23,792) (41,053) (13,439) (14,940) 5,342 (87,882)
By business – as restated
Revenues
Total revenues 69,376 250,897 – 3,972 (35,294) 288,951
Less: sales between businesses (32,083) (1,914) – (1,297) 35,294 –
Total third party revenues 37,293 248,983 – 2,675 – 288,951
Segment results
Profit (loss) before interest and tax 27,729 6,076 – (1,233) (220) 32,352
Segment assets and liabilities
Segment assets 125,736 95,311 – 20,595 (6,271) 235,371
Segment liabilities (37,741) (41,409) – (14,074) 5,342 (87,882)
$ million
2006
Gas, Other Consolidation
Exploration Refining Power businesses adjustment Total
and and and and and Total Innovene continuing
By business – as reported Production Marketing Renewables corporate eliminations group operations operations
Revenues
Total revenues 56,400 233,302 23,923 1,243 (44,266) 270,602 – 270,602
Less: sales between businesses (36,171) (4,076) (4,019) – 44,266 – – –
Total third party revenues 20,229 229,226 19,904 1,243 – 270,602 – 270,602
Segment results
Profit (loss) before interest and tax 29,629 5,041 1,321 (1,069) 52 34,974 184 35,158
By business – as restated
Revenues
Total revenues 71,868 232,833 – 3,703 (37,802) 270,602 – 270,602
Less: sales between businesses (32,608) (3,935) – (1,259) 37,802 – – –
Total third party revenues 39,260 228,898 – 2,444 – 270,602 – 270,602
Segment results
Profit (loss) before interest and tax 30,953 4,919 – (963) 65 34,974 184 35,158
116