BP 2008 Annual Report Download - page 7
Download and view the complete annual report
Please find page 7 of the 2008 BP annual report below. You can navigate through the pages in the report by either clicking on the pages listed below, or by using the keyword search tool below to find specific information within the annual report.-
 1
1 -
 2
2 -
 3
3 -
 4
4 -
 5
5 -
 6
6 -
 7
7 -
 8
8 -
 9
9 -
 10
10 -
 11
11 -
 12
12 -
 13
13 -
 14
14 -
 15
15 -
 16
16 -
 17
17 -
 18
18 -
19
-
20
-
21
-
22
-
23
-
24
-
25
-
26
-
27
-
28
-
29
-
30
-
31
-
32
-
33
-
34
-
35
-
36
-
37
-
38
-
39
-
40
-
41
-
42
-
43
-
44
-
45
-
46
-
47
-
48
-
49
-
50
-
51
-
52
-
53
-
54
-
55
-
56
-
57
-
58
-
59
-
60
-
61
-
62
-
63
-
64
-
65
-
66
-
67
-
68
-
69
-
70
-
71
-
72
-
73
-
74
-
75
-
76
-
77
-
78
-
79
-
80
-
81
-
82
-
83
-
84
-
85
-
86
-
87
-
88
-
89
-
90
-
91
-
92
-
93
-
94
-
95
-
96
-
97
-
98
-
99
-
100
-
101
-
102
-
103
-
104
-
105
-
106
-
107
-
108
-
109
-
110
-
111
-
112
-
113
-
114
-
115
-
116
-
117
-
118
-
119
-
120
-
121
-
122
-
123
-
124
-
125
-
126
-
127
-
128
-
129
-
130
-
131
-
132
-
133
-
134
-
135
-
136
-
137
-
138
-
139
-
140
-
141
-
142
-
143
-
144
-
145
-
146
-
147
-
148
-
149
-
150
-
151
-
152
-
153
-
154
-
155
-
156
-
157
-
158
-
159
-
160
-
161
-
162
-
163
-
164
-
165
-
166
-
167
-
168
-
169
-
170
-
171
-
172
-
173
-
174
-
175
-
176
-
177
-
178
-
179
-
180
-
181
-
182
-
183
-
184
-
185
-
186
-
187
-
188
-
189
-
190
-
191
-
192
-
193
-
194
-
195
-
196
-
197
-
198
-
199
-
200
-
201
-
202
-
203
-
204
-
205
-
206
-
207
-
208
-
209
-
210
-
211
 |
 |

BP Annual Report and Accounts 2008
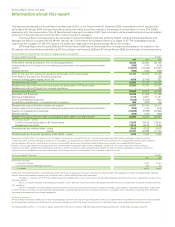
Our performance
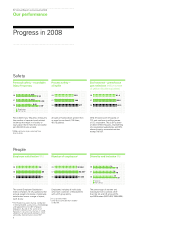
Progress in 2008
Safety
Personal safety – recordable
injury frequency
0.35
08 0.50
0.35
07 0.59
0.40
06 0.55a
Employees
Contractors
Recordable injury frequency measures
the number of reported work-related
incidents that result in a fatality or
injury (apart from minor rst aid cases)
per 200,000 hours worked.
a2006 contractor data corrected from
0.54 to 0.55.
Process safety –
oil spills
08 335
07 340
06 417
All spills of hydrocarbon greater than
or equal to one barrel (159 litres,
42 US gallons).
Environment – greenhouse
gas emissions (million tonnes
of carbon dioxide equivalent)
08 61.4
07 63.5
06 64.4
GHG emissions are emissions of
CO2 and methane in million tonnes
of CO2 equivalent. This is BP’s share
of direct GHG emissions, representing
all consolidated subsidiaries and BP’s
share of equity-accounted entities
except TNK-BP.
People
Employee satisfactiona (%)
08 59
06 66
04 64
The overall Employee Satisfaction
Index comprises 10 key questions that
provide insight into levels of employee
satisfaction across a range of topics,
such as pay.
a The People Assurance Survey, conducted
in 2004 and 2006, used a census methodology
and targeted the entire BP employee
population. Based on the same set of
questions, the Pulse Plus Survey, in 2008,
adopted a sample-based approach, which
achieved a representative view of BP.
6
Number of employeesa
08 92,000
07 98,100b
06 97,000
Employees includes all individuals
who have a contract of employment
with a BP group entity.
aAs at 31 December.
b 2007 data corrected from 97,600
to 98,100.
Diversity and inclusion (%)
08 14 19
16
07 19
17
06 20
Women
Non-UK/US
The percentage of women and
individuals from countries other
than the UK and US among BP’s
top 583 leaders (2007 624, 2006 625).