BP 2008 Annual Report Download - page 107
Download and view the complete annual report
Please find page 107 of the 2008 BP annual report below. You can navigate through the pages in the report by either clicking on the pages listed below, or by using the keyword search tool below to find specific information within the annual report.-
 1
1 -
2
-
3
-
4
-
5
-
6
-
7
-
8
-
9
-
10
-
11
-
12
-
13
-
14
-
15
-
16
-
17
-
18
-
19
-
20
-
21
-
22
-
23
-
24
-
25
-
26
-
27
-
28
-
29
-
30
-
31
-
32
-
33
-
34
-
35
-
36
-
37
-
38
-
39
-
40
-
41
-
42
-
43
-
44
-
45
-
46
-
47
-
48
-
49
-
50
-
51
-
52
-
53
-
54
-
55
-
56
-
57
-
58
-
59
-
60
-
61
-
62
-
63
-
64
-
65
-
66
-
67
-
68
-
69
-
70
-
71
-
72
-
73
-
74
-
75
-
76
-
77
-
78
-
79
-
80
-
81
-
82
-
83
-
84
-
85
-
86
-
87
-
88
-
89
-
90
-
91
-
92
-
93
-
94
-
95
-
96
-
 97
97 -
 98
98 -
 99
99 -
 100
100 -
 101
101 -
 102
102 -
 103
103 -
 104
104 -
 105
105 -
 106
106 -
 107
107 -
 108
108 -
 109
109 -
 110
110 -
 111
111 -
 112
112 -
 113
113 -
 114
114 -
 115
115 -
 116
116 -
 117
117 -
118
-
119
-
120
-
121
-
122
-
123
-
124
-
125
-
126
-
127
-
128
-
129
-
130
-
131
-
132
-
133
-
134
-
135
-
136
-
137
-
138
-
139
-
140
-
141
-
142
-
143
-
144
-
145
-
146
-
147
-
148
-
149
-
150
-
151
-
152
-
153
-
154
-
155
-
156
-
157
-
158
-
159
-
160
-
161
-
162
-
163
-
164
-
165
-
166
-
167
-
168
-
169
-
170
-
171
-
172
-
173
-
174
-
175
-
176
-
177
-
178
-
179
-
180
-
181
-
182
-
183
-
184
-
185
-
186
-
187
-
188
-
189
-
190
-
191
-
192
-
193
-
194
-
195
-
196
-
197
-
198
-
199
-
200
-
201
-
202
-
203
-
204
-
205
-
206
-
207
-
208
-
209
-
210
-
211
 |
 |

BP Annual Report and Accounts 2008
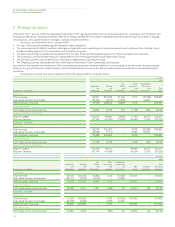
Consolidated financial statements of the BP group
Group cash flow statement
For the year ended 31 December $ million
Note 2008 2007 2006
Operating activities
Profit before taxation 34,283 31,611 34,642
Adjustments to reconcile profit before taxation to net cash provided by operating activities
Exploration expenditure written off 17 385 347 624
Depreciation, depletion and amortization 10 10,985 10,579 9,128
Impairment and (gain) loss on sale of businesses and fixed assets 8,11 380 (808) (3,165)
Earnings from jointly controlled entities and associates (3,821) (3,832) (3,995)
Dividends received from jointly controlled entities and associates 3,728 2,473 4,495
Interest receivable (407) (489) (473)
Interest received 385 500 500
Finance costs 19 1,547 1,393 986
Interest paid (1,291) (1,363) (1,242)
Net finance income relating to pensions and other post-retirement benefits 38 (591) (652) (470)
Share-based payments 459 420 416
Net operating charge for pensions and other post-retirement benefits, less
contributions and benefit payments for unfunded plans (173) (404) (261)
Net charge for provisions, less payments (298) (92) 340
(Increase) decrease in inventories 9,010 (7,255) 995
(Increase) decrease in other current and non-current assets 2,439 5,210 3,596
Increase (decrease) in other current and non-current liabilities (6,101) (3,857) (4,211)
Income taxes paid (12,824) (9,072) (13,733)
Net cash provided by operating activities 38,095 24,709 28,172
Investing activities
Capital expenditure (22,658) (17,830) (15,125)
Acquisitions, net of cash acquired (395) (1,225) (229)
Investment in jointly controlled entities (1,009) (428) (37)
Investment in associates (81) (187) (570)
Proceeds from disposal of fixed assets 5 918 1,749 5,963
Proceeds from disposal of businesses, net of cash disposed 5 11 2,518 291
Proceeds from loan repayments 647 192 189
Other (200) 374 –
Net cash used in investing activities (22,767) (14,837) (9,518)
Financing activities
Net repurchase of shares (2,567) (7,113) (15,151)
Proceeds from long-term financing 7,961 8,109 3,831
Repayments of long-term financing (3,821) (3,192) (3,655)
Net increase (decrease) in short-term debt (1,315) 1,494 3,873
Dividends paid
BP shareholders 21 (10,342) (8,106) (7,686)
Minority interest (425) (227) (283)
Net cash used in financing activities (10,509) (9,035) (19,071)
Currency translation differences relating to cash and cash equivalents (184) 135 47
Increase (decrease) in cash and cash equivalents 4,635 972 (370)
Cash and cash equivalents at beginning of year 3,562 2,590 2,960
Cash and cash equivalents at end of year 8,197 3,562 2,590
106