BP 2008 Annual Report Download - page 191
Download and view the complete annual report
Please find page 191 of the 2008 BP annual report below. You can navigate through the pages in the report by either clicking on the pages listed below, or by using the keyword search tool below to find specific information within the annual report.-
 1
1 -
2
-
3
-
4
-
5
-
6
-
7
-
8
-
9
-
10
-
11
-
12
-
13
-
14
-
15
-
16
-
17
-
18
-
19
-
20
-
21
-
22
-
23
-
24
-
25
-
26
-
27
-
28
-
29
-
30
-
31
-
32
-
33
-
34
-
35
-
36
-
37
-
38
-
39
-
40
-
41
-
42
-
43
-
44
-
45
-
46
-
47
-
48
-
49
-
50
-
51
-
52
-
53
-
54
-
55
-
56
-
57
-
58
-
59
-
60
-
61
-
62
-
63
-
64
-
65
-
66
-
67
-
68
-
69
-
70
-
71
-
72
-
73
-
74
-
75
-
76
-
77
-
78
-
79
-
80
-
81
-
82
-
83
-
84
-
85
-
86
-
87
-
88
-
89
-
90
-
91
-
92
-
93
-
94
-
95
-
96
-
97
-
98
-
99
-
100
-
101
-
102
-
103
-
104
-
105
-
106
-
107
-
108
-
109
-
110
-
111
-
112
-
113
-
114
-
115
-
116
-
117
-
118
-
119
-
120
-
121
-
122
-
123
-
124
-
125
-
126
-
127
-
128
-
129
-
130
-
131
-
132
-
133
-
134
-
135
-
136
-
137
-
138
-
139
-
140
-
141
-
142
-
143
-
144
-
145
-
146
-
147
-
148
-
149
-
150
-
151
-
152
-
153
-
154
-
155
-
156
-
157
-
158
-
159
-
160
-
161
-
162
-
163
-
164
-
165
-
166
-
167
-
168
-
169
-
170
-
171
-
172
-
173
-
174
-
175
-
176
-
177
-
178
-
179
-
180
-
 181
181 -
 182
182 -
 183
183 -
 184
184 -
 185
185 -
 186
186 -
 187
187 -
 188
188 -
 189
189 -
 190
190 -
 191
191 -
 192
192 -
 193
193 -
 194
194 -
 195
195 -
 196
196 -
 197
197 -
 198
198 -
 199
199 -
 200
200 -
 201
201 -
202
-
203
-
204
-
205
-
206
-
207
-
208
-
209
-
210
-
211
 |
 |

BP Annual Report and Accounts 2008
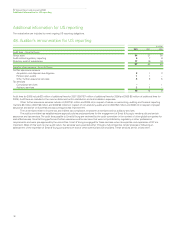
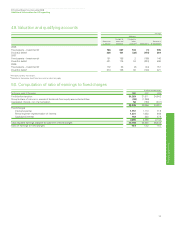
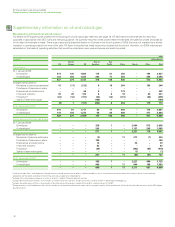
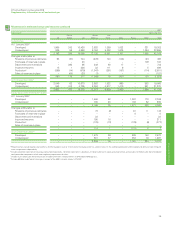
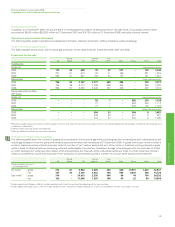
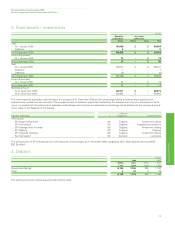
Supplementary information on oil and natural gas
Rest of Rest of Asia
UK Europe US Americas Pacific Africa Russia Other Total
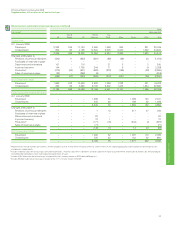
Oil and natural gas acreage at
31 December 2008 Thousands of acres
Developed – gross 390 64 7,657 3,151 1,251 500 4,072 1,876 18,961
– net 193 18 4,783 1,414 327 212 1,768 692 9,407
Undevelopeda– gross 1,615 519 7,733 15,586 7,433 21,524 10,079 14,832 79,321
– net 916 234 5,332 9,081 2,782 16,009 4,544 6,098 44,996
aUndeveloped acreage includes leases and concessions.
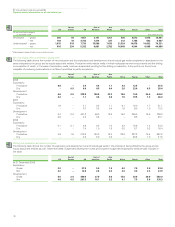
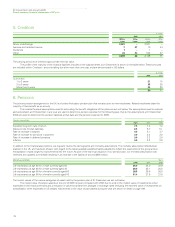
Net oil and gas wells completed or abandoned
The following table shows the number of net productive and dry exploratory and development oil and natural gas wells completed or abandoned in the
years indicated by the group and its equity-accounted entities. Productive wells include wells in which hydrocarbons were encountered and the drilling
or completion of which, in the case of exploratory wells, has been suspended pending further drilling or evaluation. A dry well is one found to be
incapable of producing hydrocarbons in sufficient quantities to justify completion.
Rest of Rest of Asia
UK Europe US Americas Pacific Africa Russia Other Total
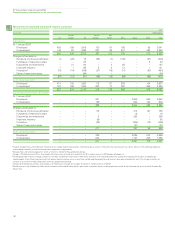
2008
Exploratory
Productive 0.8 – 2.4 4.4 1.1 4.3 12.5 – 25.5
Dry – 0.5 0.9 0.5 0.4 2.6 23.0 0.5 28.4
Development
Productive 6.6 0.5 379.8 140.8 23.3 18.6 10.0 26.6 606.2
Dry 0.2 – 1.1 3.8 0.8 1.5 19.5 1.3 28.2
2007
Exploratory
Productive 1.6 – 4.1 0.5 1.1 6.1 16.0 1.7 31.1
Dry – – 0.7 0.5 0.4 1.6 9.0 1.0 13.2
Development
Productive 0.4 0.8 401.2 46.0 13.8 15.3 246.0 15.8 739.3
Dry 0.6 – 4.2 8.8 – – 9.5 – 23.1
2006
Exploratory
Productive 0.1 0.1 2.9 0.5 1.0 3.2 15.6 1.4 24.8
Dry – – 7.4 1.0 1.5 0.5 5.7 0.3 16.4
Development
Productive 4.9 1.6 418.8 154.0 12.4 23.8 227.2 14.5 857.2
Dry – – 4.5 5.0 0.2 – 20.8 1.0 31.5
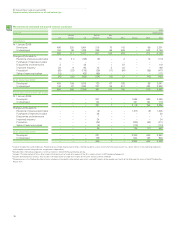
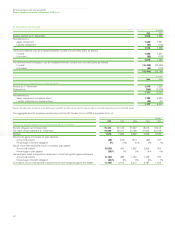
Drilling and production activities in progress
The following table shows the number of exploratory and development oil and natural gas wells in the process of being drilled by the group and its
equity-accounted entities as at 31 December 2008. Suspended development wells and long-term suspended exploratory wells are also included in
the table.
Rest of Rest of Asia
UK Europe US Americas Pacific Africa Russia Other Total
At 31 December 2008
Exploratory
Gross 2.0 – 27.0 5.0 1.0 4.0 7.0 3.0 49.0
Net 0.2 – 12.8 2.8 0.2 2.6 3.0 2.3 23.9
Development
Gross 8.0 2.0 480.0 27.0 8.0 15.0 20.0 20.0 580.0
Net 4.8 0.5 291.5 16.1 3.2 6.1 7.5 5.6 335.3
190