BP 2008 Annual Report Download - page 146
Download and view the complete annual report
Please find page 146 of the 2008 BP annual report below. You can navigate through the pages in the report by either clicking on the pages listed below, or by using the keyword search tool below to find specific information within the annual report.-
 1
1 -
2
-
3
-
4
-
5
-
6
-
7
-
8
-
9
-
10
-
11
-
12
-
13
-
14
-
15
-
16
-
17
-
18
-
19
-
20
-
21
-
22
-
23
-
24
-
25
-
26
-
27
-
28
-
29
-
30
-
31
-
32
-
33
-
34
-
35
-
36
-
37
-
38
-
39
-
40
-
41
-
42
-
43
-
44
-
45
-
46
-
47
-
48
-
49
-
50
-
51
-
52
-
53
-
54
-
55
-
56
-
57
-
58
-
59
-
60
-
61
-
62
-
63
-
64
-
65
-
66
-
67
-
68
-
69
-
70
-
71
-
72
-
73
-
74
-
75
-
76
-
77
-
78
-
79
-
80
-
81
-
82
-
83
-
84
-
85
-
86
-
87
-
88
-
89
-
90
-
91
-
92
-
93
-
94
-
95
-
96
-
97
-
98
-
99
-
100
-
101
-
102
-
103
-
104
-
105
-
106
-
107
-
108
-
109
-
110
-
111
-
112
-
113
-
114
-
115
-
116
-
117
-
118
-
119
-
120
-
121
-
122
-
123
-
124
-
125
-
126
-
127
-
128
-
129
-
130
-
131
-
132
-
133
-
134
-
135
-
 136
136 -
 137
137 -
 138
138 -
 139
139 -
 140
140 -
 141
141 -
 142
142 -
 143
143 -
 144
144 -
 145
145 -
 146
146 -
 147
147 -
 148
148 -
 149
149 -
 150
150 -
 151
151 -
 152
152 -
 153
153 -
 154
154 -
 155
155 -
 156
156 -
157
-
158
-
159
-
160
-
161
-
162
-
163
-
164
-
165
-
166
-
167
-
168
-
169
-
170
-
171
-
172
-
173
-
174
-
175
-
176
-
177
-
178
-
179
-
180
-
181
-
182
-
183
-
184
-
185
-
186
-
187
-
188
-
189
-
190
-
191
-
192
-
193
-
194
-
195
-
196
-
197
-
198
-
199
-
200
-
201
-
202
-
203
-
204
-
205
-
206
-
207
-
208
-
209
-
210
-
211
 |
 |

145
BP Annual Report and Accounts 2008
Notes on financial statements
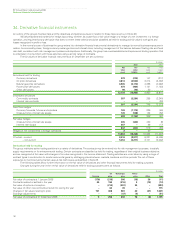
28. Financial instruments and financial risk factors continued
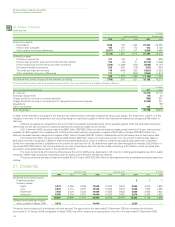
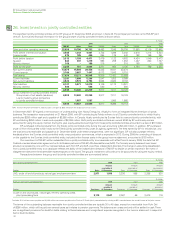
(iii) Interest rate risk
Where the group enters into money market contracts for entrepreneurial trading purposes the activity is controlled using value-at-risk techniques
as described above. This activity is described as interest rate trading in the value-at-risk table above.
BP is also exposed to interest rate risk from the possibility that changes in interest rates will affect future cash flows or the fair values of
its financial instruments, principally finance debt.
While the group issues debt in a variety of currencies based on market opportunities, it uses derivatives to swap the debt to a US dollar floating
rate exposure but in certain defined circumstances maintains a fixed rate exposure for a proportion of debt. The proportion of floating rate debt net of
interest rate swaps at 31 December 2008 was 72% of total finance debt outstanding (2007 68%). The weighted average interest rate on finance debt
at 31 December 2008 is 3% (2007 5%) and the weighted average maturity of fixed rate debt is three years (2007 two years).
The group’s earnings are sensitive to changes in interest rates on the floating rate element of the group’s finance debt. If the interest rates
applicable to floating rate instruments were to have increased by 1% on 1 January 2009, it is estimated that the group’s profit before taxation for 2009
would decrease by approximately $239 million (2007 $168 million decrease in 2008). This assumes that the amount and mix of fixed and floating rate
debt, including finance leases, remains unchanged from that in place at 31 December 2008 and that the change in interest rates is effective from the
beginning of the year. Where the interest rate applicable to an instrument is reset during a quarter it is assumed that this occurs at the beginning of the
quarter and remains unchanged for the rest of the year. In reality, the fixed/floating rate mix will fluctuate over the year and interest rates will change
continually. Furthermore, the effect on earnings shown by this analysis does not consider the effect of any other changes in general economic activity
that may accompany such an increase in interest rates.
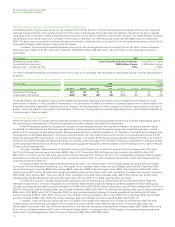
(iv) Equity price risk
The group holds equity investments, typically made for strategic purposes, that are classified as non-current available-for-sale financial assets and are
measured initially at fair value with changes in fair value recognized directly in equity. Accumulated fair value changes are recycled to the income
statement on disposal, or when the investment is impaired. Impairment losses of $546 million have been recognized in 2008 relating to listed non-
current available-for-sale investments. For further information see Note 29.
At 31 December 2008, it is estimated that an increase of 10% in quoted equity prices would result in an immediate credit to equity of
$59 million (2007 $162 million credit to equity), whilst a decrease of 10% in quoted equity prices would result in an immediate charge to profit or loss
of $48 million and a charge to equity of $11 million (2007 $162 million charge to equity).
At 31 December 2008, 56% (2007 70%) of the carrying amount of non-current available-for-sale financial assets represented the group’s stake
in Rosneft, thus the group’s exposure is concentrated on changes in the share price of this equity in particular.
(b) Credit risk
Credit risk is the risk that a customer or counterparty to a financial instrument will fail to perform or fail to pay amounts due causing financial loss to
the group and arises from cash and cash equivalents, derivative financial instruments and deposits with financial institutions and principally from credit
exposures to customers relating to outstanding receivables.
The group has a credit policy, approved by the CFO, that is designed to ensure that consistent processes are in place throughout the group to
measure and control credit risk. Credit risk is considered as part of the risk-reward balance of doing business. On entering into any business contract
the extent to which the arrangement exposes the group to credit risk is considered. Key requirements of the policy are formal delegated authorities
to the sales and marketing teams to incur credit risk and to a specialized credit function to set counterparty limits; the establishment of credit systems
and processes to ensure that counterparties are rated and limits set; and systems to monitor exposure against limits and report regularly on those
exposures, and immediately on any excesses, and to track and report credit losses. The treasury function provides a similar credit risk management
activity with respect to group-wide exposures to banks and other financial institutions.
In the current economic environment the group has placed increased emphasis on the management of credit risk. Policies and processes have
been reviewed during the year and credit exposures with banks and others have been reduced through netting and collateral arrangements, or reduced
activity where appropriate.
Before trading with a new counterparty can start, its creditworthiness is assessed and a credit rating is allocated that indicates the probability
of default, along with a credit exposure limit. The assessment process takes into account all available qualitative and quantitative information about the
counterparty and the group, if any, to which the counterparty belongs. The counterparty’s business activities, financial resources and business risk
management processes are taken into account in the assessment, to the extent that this information is publicly available or otherwise disclosed to the
group by the counterparty, together with external credit ratings, if any, including ratings prepared by Moody’s Investor Service and Standard & Poor’s.
Creditworthiness continues to be evaluated after transactions have been initiated and a watchlist of higher-risk counterparties is maintained. Once
assigned a credit rating, each counterparty is allocated a maximum exposure limit.
The group does not aim to remove credit risk but expects to experience a certain level of credit losses. The group attempts to mitigate credit
risk by entering into contracts that permit netting and allow for termination of the contract on the occurrence of certain events of default. Depending
on the creditworthiness of the counterparty, the group may require collateral or other credit enhancements such as cash deposits or letters of credit
and parent company guarantees. Trade and other derivative assets and liabilities are presented on a net basis where unconditional netting
arrangements are in place with counterparties and where there is an intent to settle amounts due on a net basis. The maximum credit exposure
associated with financial assets is equal to the carrying amount. At 31 December 2008, the maximum credit exposure was $52,413 million (2007
$53,498 million). Collateral received and recognized in the balance sheet at the year-end was $1,121 million (2007 $39 million) and collateral held off
balance sheet was $203 million (2007 $474 million). Credit exposure exists in relation to guarantees issued by group companies under which amounts
outstanding at 31 December 2008 were $223 million (2007 $443 million) in respect of liabilities of jointly controlled entities and associates and
$613 million (2007 $601 million) in respect of liabilities of other third parties.
Financial statements