BP 2008 Annual Report Download - page 32
Download and view the complete annual report
Please find page 32 of the 2008 BP annual report below. You can navigate through the pages in the report by either clicking on the pages listed below, or by using the keyword search tool below to find specific information within the annual report.-
 1
1 -
2
-
3
-
4
-
5
-
6
-
7
-
8
-
9
-
10
-
11
-
12
-
13
-
14
-
15
-
16
-
17
-
18
-
19
-
20
-
21
-
 22
22 -
 23
23 -
 24
24 -
 25
25 -
 26
26 -
 27
27 -
 28
28 -
 29
29 -
 30
30 -
 31
31 -
 32
32 -
 33
33 -
 34
34 -
 35
35 -
 36
36 -
 37
37 -
 38
38 -
 39
39 -
 40
40 -
 41
41 -
 42
42 -
43
-
44
-
45
-
46
-
47
-
48
-
49
-
50
-
51
-
52
-
53
-
54
-
55
-
56
-
57
-
58
-
59
-
60
-
61
-
62
-
63
-
64
-
65
-
66
-
67
-
68
-
69
-
70
-
71
-
72
-
73
-
74
-
75
-
76
-
77
-
78
-
79
-
80
-
81
-
82
-
83
-
84
-
85
-
86
-
87
-
88
-
89
-
90
-
91
-
92
-
93
-
94
-
95
-
96
-
97
-
98
-
99
-
100
-
101
-
102
-
103
-
104
-
105
-
106
-
107
-
108
-
109
-
110
-
111
-
112
-
113
-
114
-
115
-
116
-
117
-
118
-
119
-
120
-
121
-
122
-
123
-
124
-
125
-
126
-
127
-
128
-
129
-
130
-
131
-
132
-
133
-
134
-
135
-
136
-
137
-
138
-
139
-
140
-
141
-
142
-
143
-
144
-
145
-
146
-
147
-
148
-
149
-
150
-
151
-
152
-
153
-
154
-
155
-
156
-
157
-
158
-
159
-
160
-
161
-
162
-
163
-
164
-
165
-
166
-
167
-
168
-
169
-
170
-
171
-
172
-
173
-
174
-
175
-
176
-
177
-
178
-
179
-
180
-
181
-
182
-
183
-
184
-
185
-
186
-
187
-
188
-
189
-
190
-
191
-
192
-
193
-
194
-
195
-
196
-
197
-
198
-
199
-
200
-
201
-
202
-
203
-
204
-
205
-
206
-
207
-
208
-
209
-
210
-
211
 |
 |

BP Annual Report and Accounts 2008
Performance review
Refining and Marketing
Our Refining and Marketing business is responsible for the supply and
trading, refining, manufacturing, marketing and transportation of crude
oil, petroleum, chemicals products and related services to wholesale and
retail customers. BP markets its products in more than 100 countries. We
operate primarily in Europe and North America and also manufacture and
market our products across Australasia, in China and other parts of Asia,
Africa and Central and South America.
In 2008 we restructured the Refining and Marketing organization
into two main business groupings: fuels value chains (FVCs) and
international businesses (IBs). The FVCs integrate the activities of
refining, logistics, marketing, supply and trading, on a regional basis,
recognizing that the markets for our main fuels products operate
regionally. This shift to a more geographic and integrated model
represents a major simplification step and the opportunity to create
better value from our physical assets (refineries, terminals, pipelines and
retail stations). The IBs include the manufacturing, supply and marketing
of lubricants, petrochemicals, liquefied petroleum gas (LPG) and aviation
and marine fuels. We believe each of these IBs is competitively
advantaged in the markets in which we have chosen to participate. Such
advantage is derived from several factors, including location, proximity of
manufacturing assets to markets, physical asset quality, operational
efficiency, technology advantage and the strength of our brands. Each
business has a clear strategy focused on investing in its key assets and
market positions in order to deliver value to its customers and out-
perform its competitors.
During the past five years, our focus has been on process safety,
upgrading organizational capability and significant integrity management
investment. The construction of new production units at many of our
refineries as well as upgrades of existing conversion units at a number of
our facilities has positioned our assets to produce the high-quality fuels
needed to meet today's heightened product specifications.
Our performance in 2008
The 2008 environment in which the segment operated was very
challenging, characterized by high and volatile crude and product prices,
which resulted in substantial margin volatility as well as higher energy
costs in manufacturing. Crude prices fell significantly in the second half of
the year and at the end of the year, prices were around $50/bbl lower
than the start of the year. Refining margins in the US were significantly
weaker than 2007 due to weaker gasoline demand. Conversely, in
Europe, where diesel accounts for a larger share of regional demand,
margins were stronger than a year ago. Demand for fuels has fallen,
initially due to high oil prices and subsequently due to the slowing of
global economies and the impact of the financial crisis. During the fourth
quarter, we saw a dramatic decline in the demand for our petrochemicals
products as a consequence of the economic slowdown. The year also
saw material swings in foreign exchange rates, particularly in the second
half, that affected our results.
Our 2008 performance reflects the benefits of the fundamental
improvements we are making across the business, including the
measures we have taken to restore the availability of our refining system,
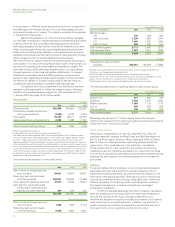
reduce costs and simplify the organization. The loss before interest and
tax was $1.9 billion for 2008, compared with a profit before interest and
tax of $6.1 billion in 2007. The decrease was primarily driven by inventory-
holding losses. Our financial results are discussed in more detail on
pages 54-55.
Safety, both process and personal, remains our top priority. During 2008,
we started the migration to the new BP Operating Management System
(OMS) with an increased focus on process safety and continuous
improvement. The OMS is described in further detail on page 44. At the
end of the year, two of our petrochemicals plants in the US and two of
our refineries in Europe were operating on OMS. Within our US
refineries, we continue to implement the recommendations from the BP
US Refineries Independent Safety Review Panel. We have worked closely
with the independent expert, L Duane Wilson. The number of major
incidents associated with integrity management has decreased by 90%
since 2005. We have also reduced the number of oil spills by 60% and
the recordable injury rate by more than 57% since 1999. Regrettably, in
2008 there were four workforce fatalities associated with our operations,
one of which was a process safety incident.
In 2008, we saw the first substantial benefits of our operational
improvements. The Whiting refinery was restored to its full clean fuel
capability of 360mb/d in March 2008 following the compressor failure and
fire that took place during 2007. Texas City was also restored to full
economic capability by the end of the year. In Europe and Rest of World,
we commissioned new upgrading units at the Rotterdam and Kwinana
refineries, enhanced processing capability at the Gelsenkirchen refinery,
reconfigured the Bayernoil refinery for more efficient and competitive
operation, and completed construction of a new coker at the Castellón
refinery. During the next five years, we intend to continue the focus on
process safety, improve the competitive performance of our refineries
and complete the previously announced investment in the Whiting
refinery to increase its ability to process Canadian heavy crude.
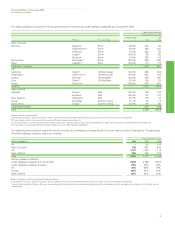
In total, our 17 refineries worldwide, including those partially
owned, achieved throughputs of 2,155mb/d on average, a 5% increase
on 2007 after adjusting for the net loss of throughput from previous
disposals and acquisitions. The performance of Texas City was impacted
by Hurricane Ike in September, which meant we had to shut down the
refinery in advance as a precautionary measure, along with other
refineries in the area. Operational disruption was minimized as crude
processing was restored in seven days and full operations restored within
three weeks. This was due to a terrific response from employees and
also reflected the improvements we have made to our assets at Texas
City over the last few years.
During 2008, we fully integrated our refining, logistics, marketing,
supply and trading activities, establishing six refining-to-marketing
integrated FVCs focused on refining and selling ground transportation
fuels in each region. This has enabled us to simplify internal interfaces,
optimize margins, reduce overhead costs and drive continuous
improvement. During the year, we continued the implementation of our
ampm convenience retail franchise model in the US, which we expect to
provide reliable long-term sales growth for our refinery systems, together
with reduced costs and lower levels of capital investment. In Europe,
where we are one of the largest forecourt convenience retailers, with
about 2,500 shops in 10 countries, we are growing our food-on-the-go
and fresh grocery services through BP-owned brands and partnerships
with leading retailers such as Marks & Spencer.
In relation to our IBs during 2008, in the lubricants business we
focused on enhancing our customer relationships and brand
distinctiveness, together with simplifying operations and improving
efficiency. Although 2008 was a difficult year for the aviation industry, in
Air BP, we simplified our footprint by exiting non-core countries resulting
in a reduction in working capital and improved returns on operating
capital employed. During the year, the environment in which our
petrochemicals businesses operate became more challenging as
deterioration in the global economic market led to reduced demand for
our products.
We are simplifying the structure of our organization, improving the
efficiency of our back office and reducing our headcount, including the
number of senior management positions.
Performance review
31