BP 2008 Annual Report Download - page 157
Download and view the complete annual report
Please find page 157 of the 2008 BP annual report below. You can navigate through the pages in the report by either clicking on the pages listed below, or by using the keyword search tool below to find specific information within the annual report.-
 1
1 -
2
-
3
-
4
-
5
-
6
-
7
-
8
-
9
-
10
-
11
-
12
-
13
-
14
-
15
-
16
-
17
-
18
-
19
-
20
-
21
-
22
-
23
-
24
-
25
-
26
-
27
-
28
-
29
-
30
-
31
-
32
-
33
-
34
-
35
-
36
-
37
-
38
-
39
-
40
-
41
-
42
-
43
-
44
-
45
-
46
-
47
-
48
-
49
-
50
-
51
-
52
-
53
-
54
-
55
-
56
-
57
-
58
-
59
-
60
-
61
-
62
-
63
-
64
-
65
-
66
-
67
-
68
-
69
-
70
-
71
-
72
-
73
-
74
-
75
-
76
-
77
-
78
-
79
-
80
-
81
-
82
-
83
-
84
-
85
-
86
-
87
-
88
-
89
-
90
-
91
-
92
-
93
-
94
-
95
-
96
-
97
-
98
-
99
-
100
-
101
-
102
-
103
-
104
-
105
-
106
-
107
-
108
-
109
-
110
-
111
-
112
-
113
-
114
-
115
-
116
-
117
-
118
-
119
-
120
-
121
-
122
-
123
-
124
-
125
-
126
-
127
-
128
-
129
-
130
-
131
-
132
-
133
-
134
-
135
-
136
-
137
-
138
-
139
-
140
-
141
-
142
-
143
-
144
-
145
-
146
-
 147
147 -
 148
148 -
 149
149 -
 150
150 -
 151
151 -
 152
152 -
 153
153 -
 154
154 -
 155
155 -
 156
156 -
 157
157 -
 158
158 -
 159
159 -
 160
160 -
 161
161 -
 162
162 -
 163
163 -
 164
164 -
 165
165 -
 166
166 -
 167
167 -
168
-
169
-
170
-
171
-
172
-
173
-
174
-
175
-
176
-
177
-
178
-
179
-
180
-
181
-
182
-
183
-
184
-
185
-
186
-
187
-
188
-
189
-
190
-
191
-
192
-
193
-
194
-
195
-
196
-
197
-
198
-
199
-
200
-
201
-
202
-
203
-
204
-
205
-
206
-
207
-
208
-
209
-
210
-
211
 |
 |

BP Annual Report and Accounts 2008
Notes on financial statements
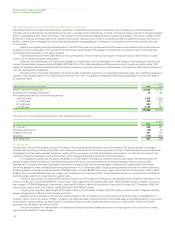
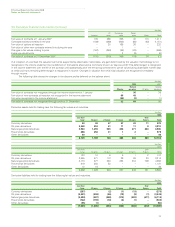
35. Finance debt continued
The following table shows, by major currency, the group’s finance debt at 31 December and the weighted average interest rates achieved at those
dates through a combination of borrowings and derivative financial instruments entered into to manage interest rate and currency exposures.
Fixed rate debt Floating rate debt
Weighted
Weighted average Weighted
average time for average
interest which rate interest
rate is fixed Amount rate Amount Total
% Years $ million % $ million $ million
2008
US dollar 5 3 9,005 2 22,116 31,121
Sterling – – – 6 21 21
Euro 4 3 74 4 1,330 1,404
Other currencies 7 10 216 7 442 658
9,295 23,909 33,204
2007
US dollar 5 2 9,541 5 20,460 30,001
Sterling – – – 6 35 35
Euro 4 4 81 5 107 188
Other currencies 7 13 268 7 553 821
9,890 21,155 31,045
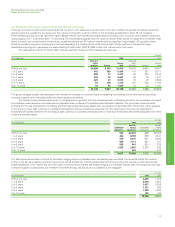
Finance leases
The group uses finance leases to acquire property, plant and equipment. These leases have terms of renewal but no purchase options and escalation
clauses. Renewals are at the option of the lessee. Future minimum lease payments under finance leases are set out below.
$ million
2008 2007
Future minimum lease payments payable within
1 year 116 268
2 to 5 years 361 393
Thereafter 439 630
916 1,291
Less finance charges 296 399
Net obligations 620 892
Of which – payable within 1 year 93 245
– payable within 2 to 5 years 234 217
– payable thereafter 293 430
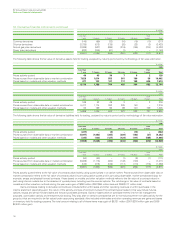
Fair values
The estimated fair value of finance debt is shown in the table below together with the carrying amount as reflected in the balance sheet.
Long-term borrowings in the table below include the portion of debt that matures in the year from 31 December 2008, whereas in the balance
sheet the amount would be reported within current liabilities.
The carrying amount of the group’s short-term borrowings, comprising mainly commercial paper, bank loans, overdrafts and US Industrial
Revenue/Municipal Bonds, approximates their fair value. The fair value of the group’s long-term borrowings and finance lease obligations is estimated
using quoted prices or, where these are not available, discounted cash flow analyses based on the group’s current incremental borrowing rates for
similar types and maturities of borrowing.
$ million
2008 2007
Carrying Carrying
Fair value amount Fair value amount
Short-term borrowings 9,913 9,913 11,212 11,212
Long-term borrowings 23,239 22,671 19,094 18,941
Net obligations under finance leases 638 620 908 892
Total finance debt 33,790 33,204 31,214 31,045
156