BP 2008 Annual Report Download - page 123
Download and view the complete annual report
Please find page 123 of the 2008 BP annual report below. You can navigate through the pages in the report by either clicking on the pages listed below, or by using the keyword search tool below to find specific information within the annual report.-
 1
1 -
2
-
3
-
4
-
5
-
6
-
7
-
8
-
9
-
10
-
11
-
12
-
13
-
14
-
15
-
16
-
17
-
18
-
19
-
20
-
21
-
22
-
23
-
24
-
25
-
26
-
27
-
28
-
29
-
30
-
31
-
32
-
33
-
34
-
35
-
36
-
37
-
38
-
39
-
40
-
41
-
42
-
43
-
44
-
45
-
46
-
47
-
48
-
49
-
50
-
51
-
52
-
53
-
54
-
55
-
56
-
57
-
58
-
59
-
60
-
61
-
62
-
63
-
64
-
65
-
66
-
67
-
68
-
69
-
70
-
71
-
72
-
73
-
74
-
75
-
76
-
77
-
78
-
79
-
80
-
81
-
82
-
83
-
84
-
85
-
86
-
87
-
88
-
89
-
90
-
91
-
92
-
93
-
94
-
95
-
96
-
97
-
98
-
99
-
100
-
101
-
102
-
103
-
104
-
105
-
106
-
107
-
108
-
109
-
110
-
111
-
112
-
 113
113 -
 114
114 -
 115
115 -
 116
116 -
 117
117 -
 118
118 -
 119
119 -
 120
120 -
 121
121 -
 122
122 -
 123
123 -
 124
124 -
 125
125 -
 126
126 -
 127
127 -
 128
128 -
 129
129 -
 130
130 -
 131
131 -
 132
132 -
 133
133 -
134
-
135
-
136
-
137
-
138
-
139
-
140
-
141
-
142
-
143
-
144
-
145
-
146
-
147
-
148
-
149
-
150
-
151
-
152
-
153
-
154
-
155
-
156
-
157
-
158
-
159
-
160
-
161
-
162
-
163
-
164
-
165
-
166
-
167
-
168
-
169
-
170
-
171
-
172
-
173
-
174
-
175
-
176
-
177
-
178
-
179
-
180
-
181
-
182
-
183
-
184
-
185
-
186
-
187
-
188
-
189
-
190
-
191
-
192
-
193
-
194
-
195
-
196
-
197
-
198
-
199
-
200
-
201
-
202
-
203
-
204
-
205
-
206
-
207
-
208
-
209
-
210
-
211
 |
 |

122
BP Annual Report and Accounts 2008
Notes on financial statements
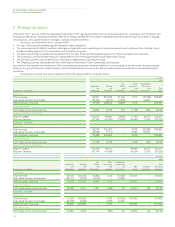
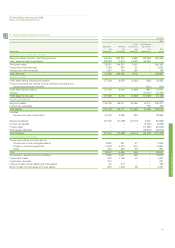
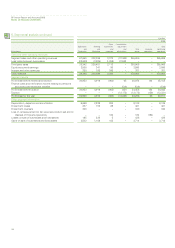
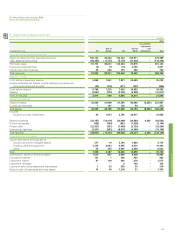
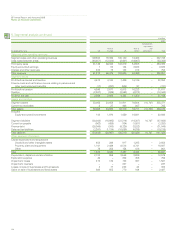
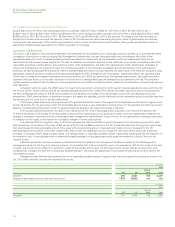
6. Segmental analysis continued
$ million
2006
Other Consolidation
Exploration Refining businesses adjustment Total
and and and and Total Innovene continuing
By business Production Marketing corporate eliminations group operations operations
Sales and other operating revenues
Segment sales and other operating revenues 67,950 232,386 3,372 (37,802) 265,906 – 265,906
Less: sales between businesses (32,608) (3,935) (1,259) 37,802 – – –
Third party sales 35,342 228,451 2,113 – 265,906 – 265,906
Equity-accounted earnings 3,568 341 86 – 3,995 – 3,995
Interest and other revenues 350 106 245 – 701 – 701
Total revenues 39,260 228,898 2,444 – 270,602 – 270,602
Segment results
Profit (loss) before interest and taxation 30,953 4,919 (963) 65 34,974 184 35,158
Finance costs and net finance income relating to pensions
and other post-retirement benefits – – – (516) (516) – (516)
Profit (loss) before taxation 30,953 4,919 (963) (451) 34,458 184 34,642
Taxation – – – (12,172) (12,172) (159) (12,331)
Profit (loss) for the year 30,953 4,919 (963) (12,623) 22,286 25 22,311
Other segment information
Depreciation, depletion and amortization 6,689 2,239 200 – 9,128 – 9,128
Impairment losses 237 155 69 – 461 – 461
Impairment reversals 340 – – – 340 – 340
Loss on remeasurement to fair value less costs to sell and on
disposal of Innovene operations – – 184 – 184 (184) –
Losses on sale of businesses and fixed assets 195 228 5 – 428 – 428
Gains on sale of businesses and fixed assets 2,502 1,109 103 – 3,714 – 3,714