BP 2008 Annual Report Download - page 182
Download and view the complete annual report
Please find page 182 of the 2008 BP annual report below. You can navigate through the pages in the report by either clicking on the pages listed below, or by using the keyword search tool below to find specific information within the annual report.-
 1
1 -
2
-
3
-
4
-
5
-
6
-
7
-
8
-
9
-
10
-
11
-
12
-
13
-
14
-
15
-
16
-
17
-
18
-
19
-
20
-
21
-
22
-
23
-
24
-
25
-
26
-
27
-
28
-
29
-
30
-
31
-
32
-
33
-
34
-
35
-
36
-
37
-
38
-
39
-
40
-
41
-
42
-
43
-
44
-
45
-
46
-
47
-
48
-
49
-
50
-
51
-
52
-
53
-
54
-
55
-
56
-
57
-
58
-
59
-
60
-
61
-
62
-
63
-
64
-
65
-
66
-
67
-
68
-
69
-
70
-
71
-
72
-
73
-
74
-
75
-
76
-
77
-
78
-
79
-
80
-
81
-
82
-
83
-
84
-
85
-
86
-
87
-
88
-
89
-
90
-
91
-
92
-
93
-
94
-
95
-
96
-
97
-
98
-
99
-
100
-
101
-
102
-
103
-
104
-
105
-
106
-
107
-
108
-
109
-
110
-
111
-
112
-
113
-
114
-
115
-
116
-
117
-
118
-
119
-
120
-
121
-
122
-
123
-
124
-
125
-
126
-
127
-
128
-
129
-
130
-
131
-
132
-
133
-
134
-
135
-
136
-
137
-
138
-
139
-
140
-
141
-
142
-
143
-
144
-
145
-
146
-
147
-
148
-
149
-
150
-
151
-
152
-
153
-
154
-
155
-
156
-
157
-
158
-
159
-
160
-
161
-
162
-
163
-
164
-
165
-
166
-
167
-
168
-
169
-
170
-
171
-
 172
172 -
 173
173 -
 174
174 -
 175
175 -
 176
176 -
 177
177 -
 178
178 -
 179
179 -
 180
180 -
 181
181 -
 182
182 -
 183
183 -
 184
184 -
 185
185 -
 186
186 -
 187
187 -
 188
188 -
 189
189 -
 190
190 -
 191
191 -
 192
192 -
193
-
194
-
195
-
196
-
197
-
198
-
199
-
200
-
201
-
202
-
203
-
204
-
205
-
206
-
207
-
208
-
209
-
210
-
211
 |
 |

Financial statements
BP Annual Report and Accounts 2008
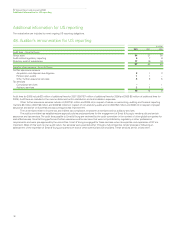
Additional information for US reporting
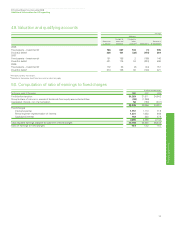
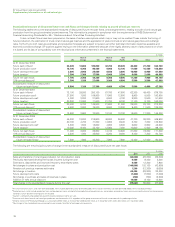
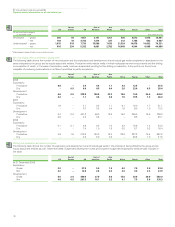
49. Valuation and qualifying accounts
$ million
Additions
Charged to Charged to
Balance at costs and other Balance at
1 January expenses accountsaDeductions 31 December
2008
Fixed assets – Investmentsb146 647 143 (1) 935
Doubtful debtsb406 191 (32) (174) 391
2007
Fixed assets – Investmentsb151 158 2 (165) 146
Doubtful debtsb421 175 34 (224) 406
2006
Fixed assets – Investmentsb172 26 (3) (44) 151
Doubtful debtsb374 158 32 (143) 421
aPrincipally currency transactions.
bDeducted in the balance sheet from the assets to which they apply.
50. Computation of ratio of earnings to fixed charges
$ million, except ratios
For the year ended 31 December 2008 2007 2006
Profit before taxation 34,283 31,611 34,642
Group’s share of income in excess of dividends from equity-accounted entities (93) (1,359) –
Capitalized interest, net of amortization 56 (183) (341)
34,246 30,069 34,301
Fixed charges
Interest expense 1,157 1,110 718
Rental expense representative of interest 1,231 1,033 946
Capitalized interest 162 323 478
2,550 2,466 2,142
Total adjusted earnings available for payment of fixed charges 36,796 32,535 36,443
Ratio of earnings to fixed charges 14.4 13.2 17.0
181