BP 2008 Annual Report Download - page 59
Download and view the complete annual report
Please find page 59 of the 2008 BP annual report below. You can navigate through the pages in the report by either clicking on the pages listed below, or by using the keyword search tool below to find specific information within the annual report.-
 1
1 -
2
-
3
-
4
-
5
-
6
-
7
-
8
-
9
-
10
-
11
-
12
-
13
-
14
-
15
-
16
-
17
-
18
-
19
-
20
-
21
-
22
-
23
-
24
-
25
-
26
-
27
-
28
-
29
-
30
-
31
-
32
-
33
-
34
-
35
-
36
-
37
-
38
-
39
-
40
-
41
-
42
-
43
-
44
-
45
-
46
-
47
-
48
-
 49
49 -
 50
50 -
 51
51 -
 52
52 -
 53
53 -
 54
54 -
 55
55 -
 56
56 -
 57
57 -
 58
58 -
 59
59 -
 60
60 -
 61
61 -
 62
62 -
 63
63 -
 64
64 -
 65
65 -
 66
66 -
 67
67 -
 68
68 -
 69
69 -
70
-
71
-
72
-
73
-
74
-
75
-
76
-
77
-
78
-
79
-
80
-
81
-
82
-
83
-
84
-
85
-
86
-
87
-
88
-
89
-
90
-
91
-
92
-
93
-
94
-
95
-
96
-
97
-
98
-
99
-
100
-
101
-
102
-
103
-
104
-
105
-
106
-
107
-
108
-
109
-
110
-
111
-
112
-
113
-
114
-
115
-
116
-
117
-
118
-
119
-
120
-
121
-
122
-
123
-
124
-
125
-
126
-
127
-
128
-
129
-
130
-
131
-
132
-
133
-
134
-
135
-
136
-
137
-
138
-
139
-
140
-
141
-
142
-
143
-
144
-
145
-
146
-
147
-
148
-
149
-
150
-
151
-
152
-
153
-
154
-
155
-
156
-
157
-
158
-
159
-
160
-
161
-
162
-
163
-
164
-
165
-
166
-
167
-
168
-
169
-
170
-
171
-
172
-
173
-
174
-
175
-
176
-
177
-
178
-
179
-
180
-
181
-
182
-
183
-
184
-
185
-
186
-
187
-
188
-
189
-
190
-
191
-
192
-
193
-
194
-
195
-
196
-
197
-
198
-
199
-
200
-
201
-
202
-
203
-
204
-
205
-
206
-
207
-
208
-
209
-
210
-
211
 |
 |

BP Annual Report and Accounts 2008
Performance review
Liquidity and capital resources
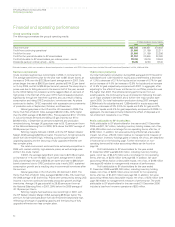
Cash flow
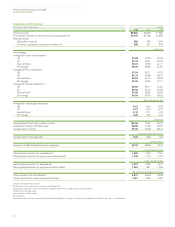
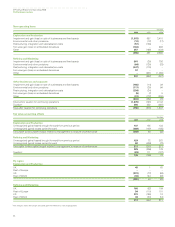
The following table summarizes the group’s cash flows.
$ million
2008 2007 2006
Net cash provided by operating activities 38,095 24,709 28,172
Net cash used in investing activities (22,767) (14,837) (9,518)
Net cash used in financing activities (10,509) (9,035) (19,071)
Currency translation differences relating to cash and cash equivalents (184) 135 47
Increase (decrease) in cash and cash equivalents 4,635 972 (370)
Cash and cash equivalents at beginning of year 3,562 2,590 2,960
Cash and cash equivalents at end of year 8,197 3,562 2,590
Net cash provided by operating activities for the year ended
31 December 2008 was $38,095 million compared with $24,709 million
for the equivalent period of 2007 reflecting a decrease in working capital
requirements of $11,250 million, an increase in profit before taxation of
$2,672 million and an increase in dividends from jointly controlled entities
and associates of $1,255 million; these were partly offset by an increase
in income taxes paid of $3,752 million.
Net cash provided by operating activities for the year ended
31 December 2007 was $24,709 million, compared with $28,172 million
for the equivalent period for 2006 reflecting an increase in working capital
requirements of $6,282 million, a decrease in profit before taxation from
continuing operations of $3,031 million, a decrease in dividends from
jointly controlled entities and associates of $2,022 million; these were
partially offset by a decrease in income taxes paid of $4,661 million,
a lower net credit for impairment and gains and losses on sale of
businesses and fixed assets of $2,357 million and higher depreciation,
depletion and amortization of $1,451 million.
Net cash used in investing activities was $22,767 million in 2008,
compared with $14,837 million and $9,518 million in 2007 and 2006.
The increase in 2008 reflected a reduction in disposal proceeds of
$3,338 million and an increase in capital expenditure of $5,303 million.
The increase in 2007 reflected a reduction in disposal proceeds of
$1,987 million and an increase in capital expenditure of $2,713 million.
Net cash used in financing activities was $10,509 million in 2008
compared with $9,035 million in 2007 and $19,071 million in 2006. The
increase in 2008 reflects a decrease in short-term debt of $2,809 million
and an increase in dividends paid of $2,434 million; these were partly
offset by a $4,546 million decrease in the net repurchase of shares.
The reduction in 2007 compared with 2006 reflects a reduction in net
repurchases of shares of $8,038 million and an increase in proceeds from
long-term financing of $4,278 million; these were partially offset by a net
decrease in short-term debt of $2,379 million.
The group has had significant levels of capital investment for
many years. Cash flow in respect of capital investment, excluding
acquisitions, was $23.7 billion in 2008, $18.4 billion in 2007 and
$15.7 billion in 2006. Sources of funding are completely fungible, but the
majority of the group’s funding requirements for new investment come
from cash generated by existing operations. The group’s level of net debt,
that is debt less cash and cash equivalents, was $25.0 billion at the end
of 2008, $26.8 billion at the end of 2007 and was $21.1 billion at the end
of 2006.
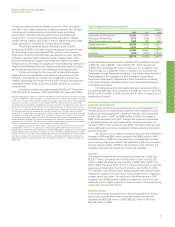
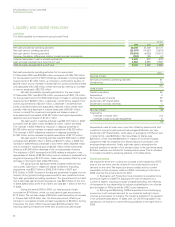
During the period 2006 to 2008, our total sources of cash
amounted to $104 billion, whilst our total uses of cash amounted to
$112 billion. The net cash usage of $8 billion was financed by an increase
in finance debt of $13 billion over the three-year period, offset by an
increase in our balance of cash and cash equivalents of $5 billion. During
this period, the price of Brent has averaged $78.26 per barrel. The
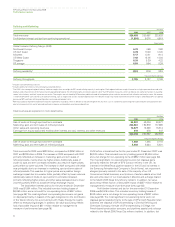
following table summarizes the three-year sources and uses of cash.
58
$ billion
Sources of cash
Net cash provided by operating activities 91
Divestments 13
104
Uses of cash
Capital expenditure 58
Acquisitions 2
Net repurchase of shares 25
Dividends to BP shareholders 26
Dividends to minority interests 1
112
Net use of cash (8)
Financed by
Increase in finance debt (13)
Increase in cash and cash equivalents 5
(8)
Acquisitions made for cash were more than offset by divestments. Net
investment during the same period has averaged $16 billion per year.
Dividends to BP shareholders, which grew on average by 16.8% per year
in dollar terms, used $26 billion. Net repurchase of shares was
$25 billion, which includes $26 billion in respect of our share buyback
programme less net proceeds from shares issued in connection with
employee share schemes. Finally, cash was used to strengthen the
financial condition of certain of our pension plans. In the past three years,
$2 billion has been contributed to funded pension plans. This is reflected
in net cash provided by operating activities in the table above.
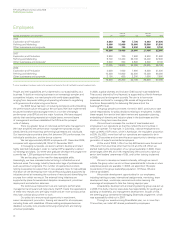
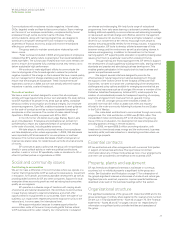
Trend information
We expect the short-term outlook for oil prices to be impacted by OPEC
cuts on the one hand, and the outlook for the world economy and oil
demand on the other. We expect continued volatility and our current
expectation is that oil prices, relative to 2008, will continue to be low in
2009, and that this could extend into 2010.
In Exploration and Production, total production is expected to be
somewhat higher in 2009. The actual growth rate will depend on a
number of factors, including our pace of capital spending, the efficiency
of that spend (in turn depending on industry cost deflation), the oil price
and its impact on PSAs as well as OPEC quota restrictions.
In Refining and Marketing, 2009 is expected to be a challenging
environment with reduced demand for our products, leading to lower
volumes and pressure on margins. The impact is expected to be greatest
in the petrochemicals sector. In 2009, with our US refining system fully
operational, we expect our overall refining availability to be higher than in
2008.