BP 2008 Annual Report Download - page 148
Download and view the complete annual report
Please find page 148 of the 2008 BP annual report below. You can navigate through the pages in the report by either clicking on the pages listed below, or by using the keyword search tool below to find specific information within the annual report.-
 1
1 -
2
-
3
-
4
-
5
-
6
-
7
-
8
-
9
-
10
-
11
-
12
-
13
-
14
-
15
-
16
-
17
-
18
-
19
-
20
-
21
-
22
-
23
-
24
-
25
-
26
-
27
-
28
-
29
-
30
-
31
-
32
-
33
-
34
-
35
-
36
-
37
-
38
-
39
-
40
-
41
-
42
-
43
-
44
-
45
-
46
-
47
-
48
-
49
-
50
-
51
-
52
-
53
-
54
-
55
-
56
-
57
-
58
-
59
-
60
-
61
-
62
-
63
-
64
-
65
-
66
-
67
-
68
-
69
-
70
-
71
-
72
-
73
-
74
-
75
-
76
-
77
-
78
-
79
-
80
-
81
-
82
-
83
-
84
-
85
-
86
-
87
-
88
-
89
-
90
-
91
-
92
-
93
-
94
-
95
-
96
-
97
-
98
-
99
-
100
-
101
-
102
-
103
-
104
-
105
-
106
-
107
-
108
-
109
-
110
-
111
-
112
-
113
-
114
-
115
-
116
-
117
-
118
-
119
-
120
-
121
-
122
-
123
-
124
-
125
-
126
-
127
-
128
-
129
-
130
-
131
-
132
-
133
-
134
-
135
-
136
-
137
-
 138
138 -
 139
139 -
 140
140 -
 141
141 -
 142
142 -
 143
143 -
 144
144 -
 145
145 -
 146
146 -
 147
147 -
 148
148 -
 149
149 -
 150
150 -
 151
151 -
 152
152 -
 153
153 -
 154
154 -
 155
155 -
 156
156 -
 157
157 -
 158
158 -
159
-
160
-
161
-
162
-
163
-
164
-
165
-
166
-
167
-
168
-
169
-
170
-
171
-
172
-
173
-
174
-
175
-
176
-
177
-
178
-
179
-
180
-
181
-
182
-
183
-
184
-
185
-
186
-
187
-
188
-
189
-
190
-
191
-
192
-
193
-
194
-
195
-
196
-
197
-
198
-
199
-
200
-
201
-
202
-
203
-
204
-
205
-
206
-
207
-
208
-
209
-
210
-
211
 |
 |

Financial statements
BP Annual Report and Accounts 2008
Notes on financial statements
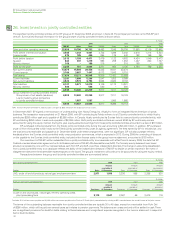
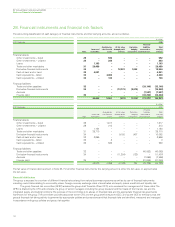
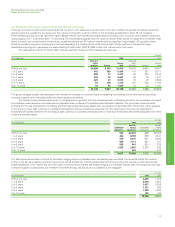
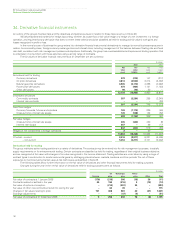
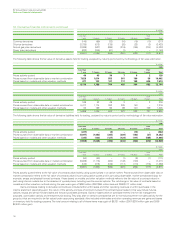
28. Financial instruments and financial risk factors continued
There are amounts included within finance debt that we show in the table below as due within one year to reflect the earliest contractual repayment
dates but that are expected to be repaid over the maximum long-term maturity profiles of the contracts as described in Note 35. US Industrial
Revenue/Municipal Bonds of $3,166 million (2007 $2,880 million) with earliest contractual repayment dates within one year have expected repayment
dates ranging from 1 to 40 years (2007 1 to 35 years). The bondholders typically have the option to tender these bonds for repayment on interest reset
dates; however, any bonds that are tendered are usually remarketed and BP has not experienced any significant repurchases. BP considers these
bonds to represent long-term funding when internally assessing the maturity profile of its finance debt. Similar treatment is applied for loans
associated with long-term gas supply contracts totalling $1,806 million (2007 $1,899 million) that mature within nine years.
The table also shows the timing of cash outflows relating to trade and other payables and accruals.
$ million
At 31 December 2008 2007
Trade and Trade and
other Finance other Finance
payables Accruals debt payables Accruals debt
Within one year 30,598 6,743 16,670 39,576 6,640 16,561
1 to 2 years 402 359 5,934 147 351 8,011
2 to 3 years 898 77 3,419 62 245 3,515
3 to 4 years 902 72 2,647 26 78 1,447
4 to 5 years 223 67 5,072 30 49 2,352
5 to 10 years 53 164 1,316 197 200 1,100
Over 10 years 64 45 1,050 24 36 1,447
33,140 7,527 36,108 40,062 7,599 34,433
The group manages liquidity risk associated with derivative contracts on a portfolio basis, considering both physical commodity sale and purchase
contracts together with financially-settled derivative assets and liabilities.
The held-for-trading derivatives amounts in the table below represent the total contractual cash outflows by period for the purchases of physical
commodities under derivative contracts and the estimated cash outflows of financially-settled derivative liabilities. The group also holds derivative
contracts for the sale of physical commodities and financially-settled derivative assets that are expected to generate cash inflows that will be available
to the group to meet cash outflows on purchases and liabilities. These contracts are excluded from the table below. The amounts disclosed for
embedded derivatives represent the contractual cash outflows of purchase contracts some of which have embedded derivatives associated with them
which are financial assets.
$ million
At 31 December 2008 2007
Held-for- Held-for-
Embedded trading Embedded trading
derivatives derivatives derivatives derivatives
Within one year 562 60,270 699 82,465
1 to 2 years 403 8,189 659 8,541
2 to 3 years 470 2,437 641 2,906
3 to 4 years 509 1,111 627 707
4 to 5 years 535 841 624 338
5 to 10 years 1,538 2,087 2,342 592
Over 10 years – 553 – 447
4,017 75,488 5,592 95,996
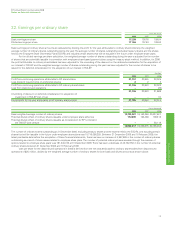
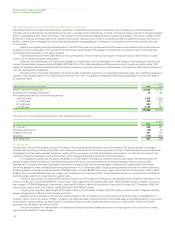
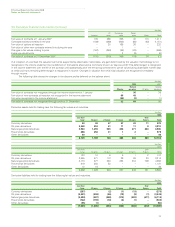
The table below shows cash outflows for derivative hedging instruments based upon contractual payment dates. The amounts reflect the maturity
profile of the fair value liability where the instruments will be settled net, and the gross settlement amount where the pay leg of a derivative will be
settled separately to the receive leg, as in the case of cross-currency interest rate swaps hedging non-US dollar finance debt. The swaps are with high
investment-grade counterparties and therefore the settlement day risk exposure is considered to be negligible.
$ million
At 31 December 2008 2007
Within one year 3,426 1,708
1 to 2 years 3,024 1,220
2 to 3 years 1,037 3,759
3 to 4 years 1,731 365
4 to 5 years 1,389 1,650
5 to 10 years 129 105
10,736 8,807
147