BP 2008 Annual Report Download - page 158
Download and view the complete annual report
Please find page 158 of the 2008 BP annual report below. You can navigate through the pages in the report by either clicking on the pages listed below, or by using the keyword search tool below to find specific information within the annual report.-
 1
1 -
2
-
3
-
4
-
5
-
6
-
7
-
8
-
9
-
10
-
11
-
12
-
13
-
14
-
15
-
16
-
17
-
18
-
19
-
20
-
21
-
22
-
23
-
24
-
25
-
26
-
27
-
28
-
29
-
30
-
31
-
32
-
33
-
34
-
35
-
36
-
37
-
38
-
39
-
40
-
41
-
42
-
43
-
44
-
45
-
46
-
47
-
48
-
49
-
50
-
51
-
52
-
53
-
54
-
55
-
56
-
57
-
58
-
59
-
60
-
61
-
62
-
63
-
64
-
65
-
66
-
67
-
68
-
69
-
70
-
71
-
72
-
73
-
74
-
75
-
76
-
77
-
78
-
79
-
80
-
81
-
82
-
83
-
84
-
85
-
86
-
87
-
88
-
89
-
90
-
91
-
92
-
93
-
94
-
95
-
96
-
97
-
98
-
99
-
100
-
101
-
102
-
103
-
104
-
105
-
106
-
107
-
108
-
109
-
110
-
111
-
112
-
113
-
114
-
115
-
116
-
117
-
118
-
119
-
120
-
121
-
122
-
123
-
124
-
125
-
126
-
127
-
128
-
129
-
130
-
131
-
132
-
133
-
134
-
135
-
136
-
137
-
138
-
139
-
140
-
141
-
142
-
143
-
144
-
145
-
146
-
147
-
 148
148 -
 149
149 -
 150
150 -
 151
151 -
 152
152 -
 153
153 -
 154
154 -
 155
155 -
 156
156 -
 157
157 -
 158
158 -
 159
159 -
 160
160 -
 161
161 -
 162
162 -
 163
163 -
 164
164 -
 165
165 -
 166
166 -
 167
167 -
 168
168 -
169
-
170
-
171
-
172
-
173
-
174
-
175
-
176
-
177
-
178
-
179
-
180
-
181
-
182
-
183
-
184
-
185
-
186
-
187
-
188
-
189
-
190
-
191
-
192
-
193
-
194
-
195
-
196
-
197
-
198
-
199
-
200
-
201
-
202
-
203
-
204
-
205
-
206
-
207
-
208
-
209
-
210
-
211
 |
 |

Financial statements
BP Annual Report and Accounts 2008
Notes on financial statements
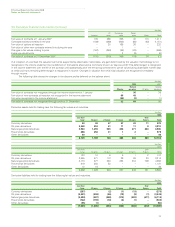
36. Capital disclosures and analysis of changes in net debt
The group defines capital as the total equity of the group. The group’s objective for managing capital is to deliver competitive, secure and sustainable
returns to maximize long-term shareholder value. BP is not subject to any externally-imposed capital requirements.
The group’s approach to managing capital is set out in its financial framework. The group aims to balance returns to shareholders between
long-term growth and current returns via the dividend whilst maintaining capital discipline in relation to investing activities and taking action on costs
to respond to the current environment. At the beginning of 2008, the group rebalanced returns to shareholders by increasing the dividend component.
As a result, the share buyback programme was curtailed and then suspended in September in light of the uncertain environment.
The group monitors capital on the basis of the net debt ratio, that is, the ratio of net debt to net debt plus equity. Net debt is calculated as gross
finance debt, as shown in the balance sheet, plus the fair value of associated derivative financial instruments that are used to hedge foreign exchange
and interest rate risks relating to finance debt, for which hedge accounting is claimed, less cash and cash equivalents. Net debt and net debt ratio are
non-GAAP measures. BP uses these measures to provide useful information to investors. Net debt enables investors to see the economic effect of
gross debt, related hedges and cash and cash equivalents in total. The net debt ratio enables investors to see how significant net debt is relative to
equity from shareholders. The derivatives are reported on the balance sheet within the headings ‘Derivative financial instruments’. All components of
equity are included in the denominator of the calculation. We believe that a net debt ratio in the range 20-30% provides an efficient capital structure
and an appropriate level of financial flexibility.
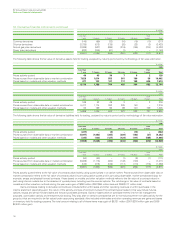
At 31 December 2008 the net debt ratio was 21% (2007 22%).
$ million
At 31 December 2008 2007
Gross debt 33,204 31,045
Less: Cash and cash equivalents 8,197 3,562
Less: Fair value (liability) asset of hedges related to finance debt (34) 666
Net debt 25,041 26,817
Equity 92,109 94,652
Net debt ratio 21% 22%
An analysis of changes in net debt is provided below.
$ million
2008 2007
Cash and Cash and
Finance cash Net Finance cash Net
Movement in net debt debt aequivalents debt debtaequivalents debt
At 1 January (30,379) 3,562 (26,817) (23,712) 2,590 (21,122)
Exchange adjustments 102 (184) (82) (122) 135 13
Net cash flow (2,825) 4,819 1,994 (6,411) 837 (5,574)
Other movements (136) – (136) (134) – (134)
At 31 December (33,238) 8,197 (25,041) (30,379) 3,562 (26,817)
aIncluding fair value of associated derivative financial instruments.
Revised definition of net debt
Net debt has been redefined to include the fair value of associated derivative financial instruments that are used to hedge foreign exchange and
interest rate risks relating to finance debt, for which hedge accounting is claimed. The derivatives are reported on the balance sheet within the
headings ‘Derivative financial instruments’. Amounts for comparative periods are presented on a consistent basis.
$ million
2007
As amended As reported
Net debt 26,817 27,483
Equity 94,652 94,652
Ratio of net debt to net debt plus equity 22% 23%
157