Abercrombie & Fitch 2010 Annual Report Download - page 79
Download and view the complete annual report
Please find page 79 of the 2010 Abercrombie & Fitch annual report below. You can navigate through the pages in the report by either clicking on the pages listed below, or by using the keyword search tool below to find specific information within the annual report.-
 1
1 -
2
-
3
-
4
-
5
-
6
-
7
-
8
-
9
-
10
-
11
-
12
-
13
-
14
-
15
-
16
-
17
-
18
-
19
-
20
-
21
-
22
-
23
-
24
-
25
-
26
-
27
-
28
-
29
-
30
-
31
-
32
-
33
-
34
-
35
-
36
-
37
-
38
-
39
-
40
-
41
-
42
-
43
-
44
-
45
-
46
-
47
-
48
-
49
-
50
-
51
-
52
-
53
-
54
-
55
-
56
-
57
-
58
-
59
-
60
-
61
-
62
-
63
-
64
-
65
-
66
-
67
-
68
-
 69
69 -
 70
70 -
 71
71 -
 72
72 -
 73
73 -
 74
74 -
 75
75 -
 76
76 -
 77
77 -
 78
78 -
 79
79 -
 80
80 -
 81
81 -
 82
82 -
 83
83 -
 84
84 -
 85
85 -
 86
86 -
 87
87 -
 88
88 -
 89
89 -
90
-
91
-
92
-
93
-
94
-
95
-
96
-
97
-
98
-
99
-
100
-
101
-
102
-
103
-
104
-
105
-
106
-
107
-
108
-
109
-
110
-
111
-
112
-
113
-
114
-
115
-
116
-
117
-
118
-
119
-
120
-
121
-
122
-
123
-
124
-
125
-
126
-
127
-
128
-
129
-
130
-
131
-
132
-
133
-
134
-
135
-
136
-
137
-
138
-
139
-
140
 |
 |

Table of Contents
ABERCROMBIE & FITCH CO.
NOTES TO CONSOLIDATED FINANCIAL STATEMENTS — (Continued)
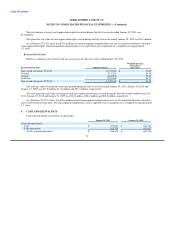
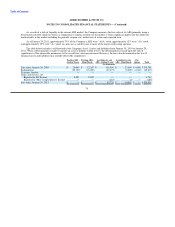
As a result of a lack of liquidity in the current ARS market, the Company measures the fair value of its ARS primarily using a
discounted cash flow model as well as a comparison to similar securities in the market. Certain significant inputs into the model are
unobservable in the market including the periodic coupon rate, market rate of return and expected term.
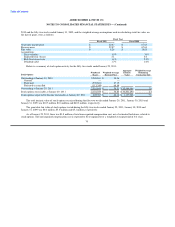
As of January 29, 2011, approximately 73% of the Company's ARS were "AAA" rated, approximately 12% were "AA" rated,
and approximately 15% were "A−" rated, in each case as rated by one or more of the major credit rating agencies.
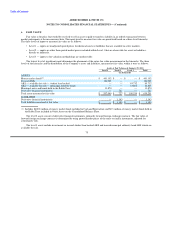
The table below includes a roll-forward of the Company's level 3 assets and liabilities from January 30, 2010 to January 29,
2011. When a determination is made to classify an asset or liability within level 3, the determination is based upon the lack of
significance of the observable parameters to the overall fair value measurement. However, the fair value determination for level 3
financial assets and liabilities may include observable components.
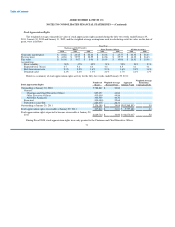
Trading ARS - Trading ARS - Available-for-sale Available-for-sale Put
Student Loans Muni Bonds ARS - Student Loans ARS - Muni Bonds Option Total
(In thousands)
Fair value, January 30, 2010 $ 20,049 $ 12,307 $ 118,390 $ 23,404 $ 4,640 $178,790
Redemptions (22,100) (15,000) (32,475) (8,600) (4,640) (82,815)
Transfers (out)/in — — — — — —
Gains and (losses), net:
Reported in Net Income 2,051 2,693 — — 4,744
Reported in Other Comprehensive Income — — (183) (2) — (185)
Fair value, January 29, 2011 $ — $ — $ 85,732 $ 14,802 $ — $100,534
76