Abercrombie & Fitch 2010 Annual Report Download - page 37
Download and view the complete annual report
Please find page 37 of the 2010 Abercrombie & Fitch annual report below. You can navigate through the pages in the report by either clicking on the pages listed below, or by using the keyword search tool below to find specific information within the annual report.-
 1
1 -
2
-
3
-
4
-
5
-
6
-
7
-
8
-
9
-
10
-
11
-
12
-
13
-
14
-
15
-
16
-
17
-
18
-
19
-
20
-
21
-
22
-
23
-
24
-
25
-
26
-
 27
27 -
 28
28 -
 29
29 -
 30
30 -
 31
31 -
 32
32 -
 33
33 -
 34
34 -
 35
35 -
 36
36 -
 37
37 -
 38
38 -
 39
39 -
 40
40 -
 41
41 -
 42
42 -
 43
43 -
 44
44 -
 45
45 -
 46
46 -
 47
47 -
48
-
49
-
50
-
51
-
52
-
53
-
54
-
55
-
56
-
57
-
58
-
59
-
60
-
61
-
62
-
63
-
64
-
65
-
66
-
67
-
68
-
69
-
70
-
71
-
72
-
73
-
74
-
75
-
76
-
77
-
78
-
79
-
80
-
81
-
82
-
83
-
84
-
85
-
86
-
87
-
88
-
89
-
90
-
91
-
92
-
93
-
94
-
95
-
96
-
97
-
98
-
99
-
100
-
101
-
102
-
103
-
104
-
105
-
106
-
107
-
108
-
109
-
110
-
111
-
112
-
113
-
114
-
115
-
116
-
117
-
118
-
119
-
120
-
121
-
122
-
123
-
124
-
125
-
126
-
127
-
128
-
129
-
130
-
131
-
132
-
133
-
134
-
135
-
136
-
137
-
138
-
139
-
140
 |
 |
Table of Contents
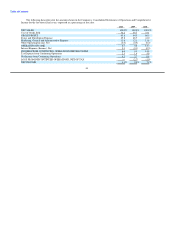
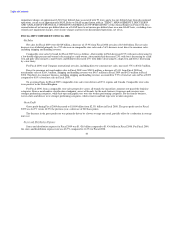
The following data represents the amounts shown in the Company's Consolidated Statements of Operations and Comprehensive
Income for the last three fiscal years, expressed as a percentage of net sales:
2010 2009 2008
NET SALES 100.0% 100.0% 100.0%
Cost of Goods Sold 36.2 35.7 33.1
GROSS PROFIT 63.8 64.3 66.9
Stores and Distribution Expense 45.8 48.7 41.2
Marketing, General and Administrative Expense 11.6 12.1 11.6
Other Operating Income, Net (0.3) (0.5) (0.3)
OPERATING INCOME 6.7 4.0 14.3
Interest Expense (Income), Net 0.1 (0.1) (0.3)
INCOME FROM CONTINUING OPERATIONS BEFORE TAXES 6.6 4.1 14.6
Tax Expense from Continuing Operations 2.3 1.4 5.8
Net Income from Continuing Operations 4.3 2.7 8.8
LOSS FROM DISCONTINUED OPERATIONS, NET OF TAX — (2.7) (1.0)
NET INCOME 4.3% 0.0% 7.8%
34