Abercrombie & Fitch 2010 Annual Report Download - page 43
Download and view the complete annual report
Please find page 43 of the 2010 Abercrombie & Fitch annual report below. You can navigate through the pages in the report by either clicking on the pages listed below, or by using the keyword search tool below to find specific information within the annual report.-
 1
1 -
2
-
3
-
4
-
5
-
6
-
7
-
8
-
9
-
10
-
11
-
12
-
13
-
14
-
15
-
16
-
17
-
18
-
19
-
20
-
21
-
22
-
23
-
24
-
25
-
26
-
27
-
28
-
29
-
30
-
31
-
32
-
 33
33 -
 34
34 -
 35
35 -
 36
36 -
 37
37 -
 38
38 -
 39
39 -
 40
40 -
 41
41 -
 42
42 -
 43
43 -
 44
44 -
 45
45 -
 46
46 -
 47
47 -
 48
48 -
 49
49 -
 50
50 -
 51
51 -
 52
52 -
 53
53 -
54
-
55
-
56
-
57
-
58
-
59
-
60
-
61
-
62
-
63
-
64
-
65
-
66
-
67
-
68
-
69
-
70
-
71
-
72
-
73
-
74
-
75
-
76
-
77
-
78
-
79
-
80
-
81
-
82
-
83
-
84
-
85
-
86
-
87
-
88
-
89
-
90
-
91
-
92
-
93
-
94
-
95
-
96
-
97
-
98
-
99
-
100
-
101
-
102
-
103
-
104
-
105
-
106
-
107
-
108
-
109
-
110
-
111
-
112
-
113
-
114
-
115
-
116
-
117
-
118
-
119
-
120
-
121
-
122
-
123
-
124
-
125
-
126
-
127
-
128
-
129
-
130
-
131
-
132
-
133
-
134
-
135
-
136
-
137
-
138
-
139
-
140
 |
 |

Table of Contents
impairment charges of approximately $0.23 per diluted share associated with 99 stores and a loss per diluted share from discontinued
operations, net of tax of approximately $0.89. Refer to GAAP reconciliation table in "ITEM 7. MANAGEMENT'S DISCUSSION
AND ANALYSIS OF FINANCIAL CONDITION AND RESULTS OF OPERATIONS" of this Annual Report on Form 10-K for a
reconciliation of net income per diluted share on a GAAP basis to net income per diluted share on a non-GAAP basis, excluding store-
related asset impairment charges, store closure charges and loss from discontinued operations, net of tax.
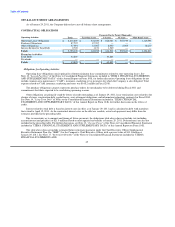
FISCAL 2009 COMPARED TO FISCAL 2008
Net Sales
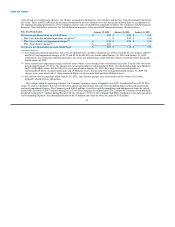
Net sales for Fiscal 2009 were $2.929 billion, a decrease of 15.9% from Fiscal 2008 net sales of $3.484 billion. The net sales
decrease was attributed primarily to a 23% decrease in comparable store sales and a 5.6% decrease in net direct-to-consumer sales,
including shipping and handling revenue.
Comparable store sales by brand for Fiscal 2009 were as follows: Abercrombie & Fitch decreased 19% with men's decreasing by
a low double-digit percent and women's decreasing by a mid twenty; abercrombie kids decreased 23% with boys' decreasing by a mid
teen and girls' decreasing by a mid twenty; and Hollister decreased 27% with dudes' decreasing by a high teen and bettys' decreasing
by a low thirty.
For Fiscal 2009, total Company international net sales, including direct-to-consumer net sales, increased 37% to $362.5 million.
Direct-to-consumer net merchandise sales in Fiscal 2009 were $249.4 million, a decrease of 5.6% from Fiscal 2008 net
merchandise sales of $264.3 million. Shipping and handling revenue was $40.7 million in Fiscal 2009 and $42.9 million in Fiscal
2008. The direct-to-consumer business, including shipping and handling revenue, accounted for 9.9% of total net sales in Fiscal 2009
compared to 8.8% of total net sales in Fiscal 2008.
On a regional basis for Fiscal 2009, comparable store sales were down in all U.S. regions and Canada. Comparable store sales
were positive in the United Kingdom.
For Fiscal 2009, from a comparable store sales perspective across all brands, the masculine categories out-paced the feminine
categories. From a merchandise classification standpoint, across all brands, for the male business, fragrance and sweaters were
stronger performing categories, while knit tops and graphic tees were the weaker performing categories. For the female business,
woven shirts and dresses were stronger performing categories, while sweaters and knit tops were weaker categories.
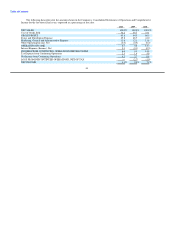
Gross Profit
Gross profit during Fiscal 2009 decreased to $1.884 billion from $2.331 billion in Fiscal 2008. The gross profit rate for Fiscal
2009 was 64.3% versus 66.9% the previous year, a decrease of 260 basis points.
The decrease in the gross profit rate was primarily driven by a lower average unit retail, partially offset by a reduction in average
unit cost.
Stores and Distribution Expense
Stores and distribution expense for Fiscal 2009 was $1.426 billion compared to $1.436 billion in Fiscal 2008. For Fiscal 2009,
the stores and distribution expense rate was 48.7% compared to 41.2% for Fiscal 2008.
40