Abercrombie & Fitch 2010 Annual Report Download - page 41
Download and view the complete annual report
Please find page 41 of the 2010 Abercrombie & Fitch annual report below. You can navigate through the pages in the report by either clicking on the pages listed below, or by using the keyword search tool below to find specific information within the annual report.-
 1
1 -
2
-
3
-
4
-
5
-
6
-
7
-
8
-
9
-
10
-
11
-
12
-
13
-
14
-
15
-
16
-
17
-
18
-
19
-
20
-
21
-
22
-
23
-
24
-
25
-
26
-
27
-
28
-
29
-
30
-
 31
31 -
 32
32 -
 33
33 -
 34
34 -
 35
35 -
 36
36 -
 37
37 -
 38
38 -
 39
39 -
 40
40 -
 41
41 -
 42
42 -
 43
43 -
 44
44 -
 45
45 -
 46
46 -
 47
47 -
 48
48 -
 49
49 -
 50
50 -
 51
51 -
52
-
53
-
54
-
55
-
56
-
57
-
58
-
59
-
60
-
61
-
62
-
63
-
64
-
65
-
66
-
67
-
68
-
69
-
70
-
71
-
72
-
73
-
74
-
75
-
76
-
77
-
78
-
79
-
80
-
81
-
82
-
83
-
84
-
85
-
86
-
87
-
88
-
89
-
90
-
91
-
92
-
93
-
94
-
95
-
96
-
97
-
98
-
99
-
100
-
101
-
102
-
103
-
104
-
105
-
106
-
107
-
108
-
109
-
110
-
111
-
112
-
113
-
114
-
115
-
116
-
117
-
118
-
119
-
120
-
121
-
122
-
123
-
124
-
125
-
126
-
127
-
128
-
129
-
130
-
131
-
132
-
133
-
134
-
135
-
136
-
137
-
138
-
139
-
140
 |
 |

Table of Contents
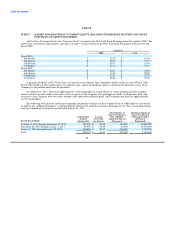
abercrombie kids increased 5%, with each of girls and guys increasing by a mid single digit. Hollister increased 6%, with bettys
increasing by a mid single digit and dudes increasing by a high single digit.
On a comparable store sales basis, Europe was the strongest performing region, while Canada and Japan were the weakest.
Within the U.S., flagship and tourist stores outperformed non-tourist stores, though all store categories experienced positive
comparable store sales.
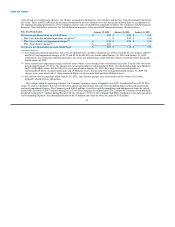
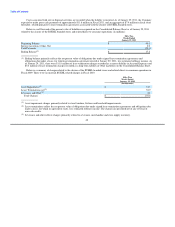
For Fiscal 2010, total Company international net sales, including direct-to-consumer net sales, increased 79% to $646.8 million.
Direct-to-consumer net merchandise sales in Fiscal 2010 were $352.5 million, an increase of 41% from Fiscal 2009
direct-to-consumer net merchandise sales of $249.4 million. Shipping and handling revenue for the corresponding periods was
$52.5 million in Fiscal 2010 and $40.7 million in Fiscal 2009. The direct-to-consumer business, including shipping and handling
revenue, accounted for 11.7% of total net sales in Fiscal 2010 compared to 9.9% in Fiscal 2009.
For Fiscal 2010, from a comparable store sales perspective across all brands, the masculine categories out-paced the feminine
categories. From a merchandise classification standpoint, woven shirts, fleece, and outerwear were stronger performing categories for
the male business while jeans and graphics were the weaker performing categories. In the female business, woven shirts, dresses, and
fleece were stronger performing categories, while knit tops and jeans were weaker performing categories.
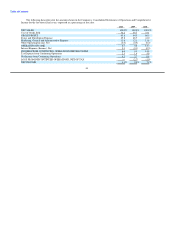
Gross Profit
Gross profit during Fiscal 2010 was $2.212 billion compared to $1.884 billion during Fiscal 2009. The gross profit rate (gross
profit divided by net sales) for Fiscal 2010 was 63.8%, down 50 basis points from the Fiscal 2009 rate of 64.3%.
The decrease in the gross profit rate for Fiscal 2010 was primarily driven by a 9% decrease in average unit retail, which was
partially offset by a reduction in average unit cost.
Stores and Distribution Expense
Stores and distribution expense for Fiscal 2010 was $1.590 billion compared to $1.426 billion in Fiscal 2009. The stores and
distribution expense rate (stores and distribution expense divided by net sales) for Fiscal 2010 was 45.8% compared to 48.7% in Fiscal
2009.
Stores and distribution expense for the fifty-two week period ended January 29, 2011 included store-related asset impairment
charges associated with 26 stores of $50.6 million, or 1.5% of net sales, and store exit charges of $4.4 million, or 0.1% of net sales,
associated with the closure of 64 domestic stores during the year. For the fifty-two weeks ended January 30, 2010, stores and
distribution expense included store-related asset impairment charges associated with 99 stores of $33.2 million, or 1.1% of net sales.
The decrease in stores and distribution expense rate for Fiscal 2010 was primarily driven by lower store occupancy and payroll
costs as a percentage of net sales.
Total direct-to-consumer expense included in stores and distribution expense were $64.8 million for Fiscal 2010, compared to
$50.1 million in Fiscal 2009.
38