Abercrombie & Fitch 2010 Annual Report Download - page 62
Download and view the complete annual report
Please find page 62 of the 2010 Abercrombie & Fitch annual report below. You can navigate through the pages in the report by either clicking on the pages listed below, or by using the keyword search tool below to find specific information within the annual report.-
 1
1 -
2
-
3
-
4
-
5
-
6
-
7
-
8
-
9
-
10
-
11
-
12
-
13
-
14
-
15
-
16
-
17
-
18
-
19
-
20
-
21
-
22
-
23
-
24
-
25
-
26
-
27
-
28
-
29
-
30
-
31
-
32
-
33
-
34
-
35
-
36
-
37
-
38
-
39
-
40
-
41
-
42
-
43
-
44
-
45
-
46
-
47
-
48
-
49
-
50
-
51
-
 52
52 -
 53
53 -
 54
54 -
 55
55 -
 56
56 -
 57
57 -
 58
58 -
 59
59 -
 60
60 -
 61
61 -
 62
62 -
 63
63 -
 64
64 -
 65
65 -
 66
66 -
 67
67 -
 68
68 -
 69
69 -
 70
70 -
 71
71 -
 72
72 -
73
-
74
-
75
-
76
-
77
-
78
-
79
-
80
-
81
-
82
-
83
-
84
-
85
-
86
-
87
-
88
-
89
-
90
-
91
-
92
-
93
-
94
-
95
-
96
-
97
-
98
-
99
-
100
-
101
-
102
-
103
-
104
-
105
-
106
-
107
-
108
-
109
-
110
-
111
-
112
-
113
-
114
-
115
-
116
-
117
-
118
-
119
-
120
-
121
-
122
-
123
-
124
-
125
-
126
-
127
-
128
-
129
-
130
-
131
-
132
-
133
-
134
-
135
-
136
-
137
-
138
-
139
-
140
 |
 |

Table of Contents
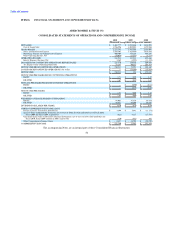
ABERCROMBIE & FITCH CO.
CONSOLIDATED STATEMENTS OF CASH FLOWS
2010 2009 2008
(Thousands)
OPERATING ACTIVITIES:
Net Income $ 150,283 $ 254 $ 272,255
Impact of Other Operating Activities on Cash Flows:
Depreciation and Amortization 229,153 238,752 225,334
Non-Cash Charge for Asset Impairment 50,631 84,754 30,574
Share-Based Compensation 40,599 36,109 42,042
Lessor Construction Allowances 35,281 47,329 55,415
Loss on Disposal / Write-off of Assets 7,064 10,646 7,607
Amortization of Deferred Lease Credits (48,373) (47,182) (43,194)
Deferred Taxes (27,823) 7,605 14,005
Tax (Deficiency) Benefit from Share-Based Compensation (1,053) (5,454) 16,839
Excess Tax Benefit from Share-Based Compensation — — (5,791)
Changes in Assets and Liabilities:
Inventories (74,689) 62,720 (40,521)
Accounts Payable and Accrued Expenses 29,365 39,394 (23,875)
Income Taxes 63,807 (7,386) (55,565)
Other Assets and Liabilities (62,456) (72,054) (4,094)
NET CASH PROVIDED BY OPERATING ACTIVITIES 391,789 395,487 491,031
INVESTING ACTIVITIES:
Capital Expenditures (160,935) (175,472) (367,602)
Purchase of Trust-Owned Life Insurance Policies (16,583) (13,539) (4,877)
Purchases of Marketable Securities — — (49,411)
Proceeds from Sales of Marketable Securities 84,542 77,450 308,673
NET CASH USED FOR INVESTING ACTIVITIES (92,976) (111,561) (113,217)
FINANCING ACTIVITIES:
Proceeds from Share-Based Compensation 13,941 2,048 55,194
Excess Tax Benefit from Share-Based Compensation — — 5,791
Proceeds from Borrowings under Credit Agreement — 48,056 100,000
Purchase of Common Stock (76,158) — (50,000)
Dividends Paid (61,656) (61,500) (60,769)
Repayment of Borrowings under Credit Agreement (12,093) (100,000) —
Change in Outstanding Checks and Other (9,367) (24,654) (19,747)
NET CASH (USED FOR) PROVIDED BY FINANCING ACTIVITIES (145,333) (136,050) 30,469
EFFECT OF EXCHANGE RATES ON CASH 2,923 3,402 (4,010)
NET INCREASE IN CASH AND EQUIVALENTS: 156,403 151,278 404,273
Cash and Equivalents, Beginning of Period 669,950 518,672 114,399
CASH AND EQUIVALENTS, END OF PERIOD $ 826,353 669,950 518,672
SIGNIFICANT NON-CASH INVESTING ACTIVITIES:
Change in Accrual for Construction in Progress $ 18,741 (21,882) (27,913)
The accompanying Notes are an integral part of these Consolidated Financial Statements.
59