Abercrombie & Fitch 2010 Annual Report Download - page 42
Download and view the complete annual report
Please find page 42 of the 2010 Abercrombie & Fitch annual report below. You can navigate through the pages in the report by either clicking on the pages listed below, or by using the keyword search tool below to find specific information within the annual report.-
 1
1 -
2
-
3
-
4
-
5
-
6
-
7
-
8
-
9
-
10
-
11
-
12
-
13
-
14
-
15
-
16
-
17
-
18
-
19
-
20
-
21
-
22
-
23
-
24
-
25
-
26
-
27
-
28
-
29
-
30
-
31
-
 32
32 -
 33
33 -
 34
34 -
 35
35 -
 36
36 -
 37
37 -
 38
38 -
 39
39 -
 40
40 -
 41
41 -
 42
42 -
 43
43 -
 44
44 -
 45
45 -
 46
46 -
 47
47 -
 48
48 -
 49
49 -
 50
50 -
 51
51 -
 52
52 -
53
-
54
-
55
-
56
-
57
-
58
-
59
-
60
-
61
-
62
-
63
-
64
-
65
-
66
-
67
-
68
-
69
-
70
-
71
-
72
-
73
-
74
-
75
-
76
-
77
-
78
-
79
-
80
-
81
-
82
-
83
-
84
-
85
-
86
-
87
-
88
-
89
-
90
-
91
-
92
-
93
-
94
-
95
-
96
-
97
-
98
-
99
-
100
-
101
-
102
-
103
-
104
-
105
-
106
-
107
-
108
-
109
-
110
-
111
-
112
-
113
-
114
-
115
-
116
-
117
-
118
-
119
-
120
-
121
-
122
-
123
-
124
-
125
-
126
-
127
-
128
-
129
-
130
-
131
-
132
-
133
-
134
-
135
-
136
-
137
-
138
-
139
-
140
 |
 |

Table of Contents
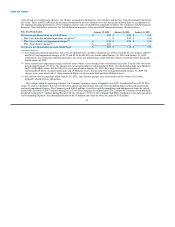
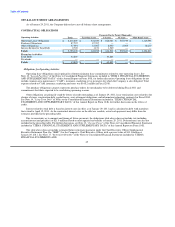
Marketing, General and Administrative Expense
Marketing, general and administrative expense during Fiscal 2010 was $400.8 million compared to $353.3 million in Fiscal
2009. For Fiscal 2010, the marketing, general and administrative expense rate (marketing, general and administrative expense divided
by net sales) was 11.6%, compared to 12.1% for Fiscal 2009.
The increase in marketing, general and administrative expense for Fiscal 2010 was primarily due to increases in compensation
and benefits, including incentive and equity compensation, and net legal expense.
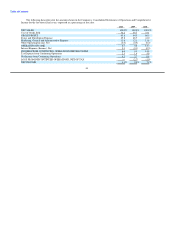
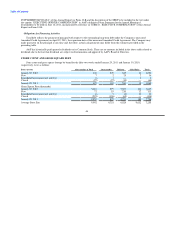
Other Operating Income, Net
Other operating income, net for Fiscal 2010 was $10.0 million compared to $13.5 million for Fiscal 2009.
The decrease for Fiscal 2010 was driven primarily by lower net gains from foreign currency denominated transactions compared
to Fiscal 2009. In Fiscal 2009, other operating income also benefited from a reduction of an other-than-temporary impairment of
$9.2 million related to the Company's trading auction rate securities, partially offset by a reduction of a related put option of
$7.7 million.
Interest Expense (Income), Net and Tax Expense from Continuing Operations
Fiscal 2010 interest expense was $7.8 million, offset by interest income of $4.4 million, compared to interest income of
$8.2 million, offset by interest expense of $6.6 million for Fiscal 2009. The decrease in interest income was primarily the result of a
lower average rate of return on investments. The increase in interest expense was due primarily to imputed interest expense related to
certain store lease transactions and higher fees associated with the unsecured amended credit agreement.
The effective tax rate from continuing operations for Fiscal 2010 was 34.3% compared to 33.9% for Fiscal 2009, in each year
benefiting from foreign operations.
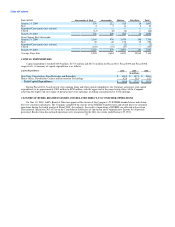
Loss from Discontinued Operations, Net of Tax
The Company completed the closure of its RUEHL branded stores and related direct-to-consumer operations in the fourth
quarter of Fiscal 2009. Accordingly, the after-tax operating results appear in Loss from Discontinued Operations, Net of Tax on the
Consolidated Statements of Operations and Comprehensive Income for all years presented. Results from discontinued operations, net
of tax, were immaterial for Fiscal 2010. Loss from discontinued operations, net of tax, was $78.7 million for Fiscal 2009.
Refer to Note 16, "Discontinued Operations," of the Notes to Consolidated Financial Statements included in "ITEM 8.
FINANCIAL STATEMENTS AND SUPPLEMENTARY DATA" of this Annual Report on Form 10-K for further discussion.
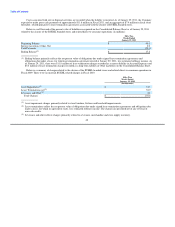
Net Income and Net Income per Diluted Share
Net income for Fiscal 2010 was $150.3 million compared to $0.3 million for Fiscal 2009. Net income per diluted share for Fiscal
2010 was $1.67 compared to $0.00 for Fiscal 2009. Net income per diluted share for Fiscal 2010 included store-related asset
impairment charges of approximately $0.34 per diluted share associated with 26 stores and store exit charges of approximately $0.03
per diluted share associated with the closure of 64 domestic stores. Net income per diluted share for Fiscal 2009 included store-related
asset
39