Abercrombie & Fitch 2010 Annual Report Download - page 45
Download and view the complete annual report
Please find page 45 of the 2010 Abercrombie & Fitch annual report below. You can navigate through the pages in the report by either clicking on the pages listed below, or by using the keyword search tool below to find specific information within the annual report.-
 1
1 -
2
-
3
-
4
-
5
-
6
-
7
-
8
-
9
-
10
-
11
-
12
-
13
-
14
-
15
-
16
-
17
-
18
-
19
-
20
-
21
-
22
-
23
-
24
-
25
-
26
-
27
-
28
-
29
-
30
-
31
-
32
-
33
-
34
-
 35
35 -
 36
36 -
 37
37 -
 38
38 -
 39
39 -
 40
40 -
 41
41 -
 42
42 -
 43
43 -
 44
44 -
 45
45 -
 46
46 -
 47
47 -
 48
48 -
 49
49 -
 50
50 -
 51
51 -
 52
52 -
 53
53 -
 54
54 -
 55
55 -
56
-
57
-
58
-
59
-
60
-
61
-
62
-
63
-
64
-
65
-
66
-
67
-
68
-
69
-
70
-
71
-
72
-
73
-
74
-
75
-
76
-
77
-
78
-
79
-
80
-
81
-
82
-
83
-
84
-
85
-
86
-
87
-
88
-
89
-
90
-
91
-
92
-
93
-
94
-
95
-
96
-
97
-
98
-
99
-
100
-
101
-
102
-
103
-
104
-
105
-
106
-
107
-
108
-
109
-
110
-
111
-
112
-
113
-
114
-
115
-
116
-
117
-
118
-
119
-
120
-
121
-
122
-
123
-
124
-
125
-
126
-
127
-
128
-
129
-
130
-
131
-
132
-
133
-
134
-
135
-
136
-
137
-
138
-
139
-
140
 |
 |

Table of Contents
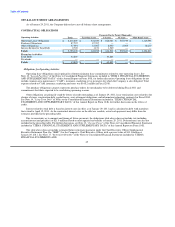
Income for all fiscal years presented. Loss from discontinued operations, net of tax, was $78.7 million and $35.9 million for Fiscal
2009 and Fiscal 2008, respectively. Loss from discontinued operations, net of tax included after-tax charges of $34.2 million
associated with the closure of the RUEHL business for Fiscal 2009, and after-tax charges of $31.4 million and $13.6 million
associated with the impairment of RUEHL-related store assets for Fiscal 2009 and Fiscal 2008, respectively.
Refer to Note 16, "Discontinued Operations" of the Notes to Consolidated Financial Statements included in "ITEM 8.
FINANCIAL STATEMENTS AND SUPPLEMENTARY DATA" of this Annual Report on Form 10-K for further discussion.
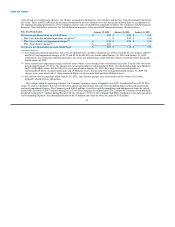
Net Income and Net Income per Diluted Share
Net income for Fiscal 2009 was $0.3 million compared to $272.3 million for Fiscal 2008. Net income per diluted share was
$0.00 in Fiscal 2009 versus $3.05 in Fiscal 2008. Net income per diluted share included $0.89 of net loss per diluted share from
discontinued operations and an after-tax charge of approximately $0.23 per diluted share associated with the impairment of store-
related assets for Fiscal 2009 and $0.40 of net loss per diluted share from discontinued operations and an after-tax charge of
approximately $0.06 per diluted share associated with the impairment of store-related assets for Fiscal 2008. Refer to GAAP
reconciliation table in "ITEM 7. MANAGEMENT'S DISCUSSION AND ANALYSIS OF FINANCIAL CONDITION AND
RESULTS OF OPERATIONS" of this Annual Report on Form 10-K for a reconciliation of net income per diluted share on a GAAP
basis to net income per diluted share on a non-GAAP basis, excluding store-related asset impairment charges, store closure charges
and loss from discontinued operations, net of tax.
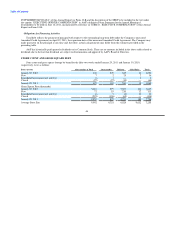
FINANCIAL CONDITION
Liquidity and Capital Resources
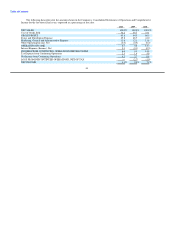
Historical Sources and Uses of Cash
Seasonality of Cash Flows
The retail business has two principal selling seasons: the Spring season which includes the first and second fiscal quarters
("Spring") and the Fall season which includes the third and fourth fiscal quarters ("Fall"). As is typical in the apparel industry, the
Company experiences its greatest sales activity during the Fall season due to Back-to-School and Holiday sales periods, particularly in
the United States. The Company relies on excess operating cash flows, which are largely generated in the Fall season, to fund
operating expenses and to reinvest in the business to support future growth throughout the year. The Company also has available a
credit facility as a source for additional funding.
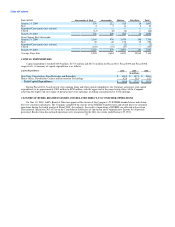
Credit Agreement
As of March 18, 2011, the Company had $305.6 million available (less outstanding letters of credit of $2.9 million) under its
unsecured Amended Credit Agreement (as amended in June 2009). The Company had $43.8 million and $50.9 million outstanding
under its unsecured Amended Credit Agreement on January 29, 2011 and January 30, 2010, respectively, denominated in Japanese
Yen. The average interest rate for Fiscal 2010 was 2.7%. The average interest rate for Fiscal 2009 was 2.0%.
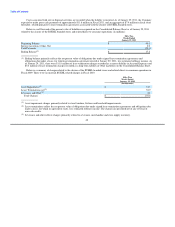
The Amended Credit Agreement requires that the Leverage Ratio not be greater than 3.75 to 1.00 at the end of each testing
period. The Company's Leverage Ratio was 2.43 as of January 29, 2011. The Amended Credit Agreement also requires that the
Coverage Ratio for A&F and its subsidiaries on a consolidated basis
42