Abercrombie & Fitch 2010 Annual Report Download - page 34
Download and view the complete annual report
Please find page 34 of the 2010 Abercrombie & Fitch annual report below. You can navigate through the pages in the report by either clicking on the pages listed below, or by using the keyword search tool below to find specific information within the annual report.-
 1
1 -
2
-
3
-
4
-
5
-
6
-
7
-
8
-
9
-
10
-
11
-
12
-
13
-
14
-
15
-
16
-
17
-
18
-
19
-
20
-
21
-
22
-
23
-
 24
24 -
 25
25 -
 26
26 -
 27
27 -
 28
28 -
 29
29 -
 30
30 -
 31
31 -
 32
32 -
 33
33 -
 34
34 -
 35
35 -
 36
36 -
 37
37 -
 38
38 -
 39
39 -
 40
40 -
 41
41 -
 42
42 -
 43
43 -
 44
44 -
45
-
46
-
47
-
48
-
49
-
50
-
51
-
52
-
53
-
54
-
55
-
56
-
57
-
58
-
59
-
60
-
61
-
62
-
63
-
64
-
65
-
66
-
67
-
68
-
69
-
70
-
71
-
72
-
73
-
74
-
75
-
76
-
77
-
78
-
79
-
80
-
81
-
82
-
83
-
84
-
85
-
86
-
87
-
88
-
89
-
90
-
91
-
92
-
93
-
94
-
95
-
96
-
97
-
98
-
99
-
100
-
101
-
102
-
103
-
104
-
105
-
106
-
107
-
108
-
109
-
110
-
111
-
112
-
113
-
114
-
115
-
116
-
117
-
118
-
119
-
120
-
121
-
122
-
123
-
124
-
125
-
126
-
127
-
128
-
129
-
130
-
131
-
132
-
133
-
134
-
135
-
136
-
137
-
138
-
139
-
140
 |
 |
Table of Contents
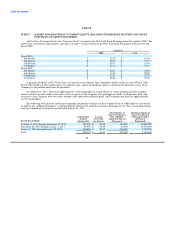
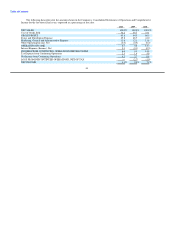
ITEM 6. SELECTED FINANCIAL DATA.
ABERCROMBIE & FITCH CO.
FINANCIAL SUMMARY
Summary of Operations
(Information below excludes amounts related to discontinued operations, except where otherwise noted)
2010 2009 2008 2007 2006(1)
(Thousands, except per share and per square foot amounts, ratios and store and associate data)
Net Sales $ 3,468,777 $ 2,928,626 $ 3,484,058 $ 3,699,656 $ 3,284,176
Gross Profit $ 2,212,181 $ 1,883,598 $ 2,331,095 $ 2,488,166 $ 2,200,668
Operating Income $ 231,932 $ 117,912 $ 498,262 $ 778,909 $ 697,990
Net Income from Continuing Operations $ 150,283 $ 78,953 $ 308,169 $ 499,127 $ 446,525
Loss from Discontinued Operations, Net of Tax(2) $ — $ (78,699) $ (35,914) $ (23,430) $ (24,339)
Net Income(2) $ 150,283 $ 254 $ 272,255 $ 475,697 $ 422,186
Dividends Declared Per Share $ 0.70 $ 0.70 $ 0.70 $ 0.70 $ 0.70
Net Income Per Share from Continuing Operations
Basic $ 1.71 $ 0.90 $ 3.55 $ 5.72 $ 5.07
Diluted $ 1.67 $ 0.89 $ 3.45 $ 5.45 $ 4.85
Loss Per Share from Discontinued Operations(2)
Basic $ — $ (0.90) $ (0.41) $ (0.27) $ (0.28)
Diluted $ — $ (0.89) $ (0.40) $ (0.26) $ (0.26)
Net Income Per Share(2)
Basic $ 1.71 $ 0.00 $ 3.14 $ 5.45 $ 4.79
Diluted $ 1.67 $ 0.00 $ 3.05 $ 5.20 $ 4.59
Basic Weighted-Average Shares Outstanding 88,061 87,874 86,816 87,248 88,052
Diluted Weighted-Average Shares Outstanding 89,851 88,609 89,291 91,523 92,010
Other Financial Information
Total Assets (including discontinued operations) $ 2,947,902 $ 2,821,866 $ 2,848,181 $ 2,567,598 $ 2,248,067
Return on Average Assets(3) 5% 0% 10% 20% 21%
Working Capital(4) $ 874,417 $ 776,311 $ 622,213 $ 585,575 $ 571,089
Current Ratio(5) 2.56 2.73 2.38 2.08 2.12
Net Cash Provided by Operating Activities(2) $ 391,789 $ 395,487 $ 491,031 $ 817,524 $ 582,171
Capital Expenditures $ 160,935 $ 175,472 $ 367,602 $ 403,345 $ 403,476
Long-Term Debt $ 68,566 $ 71,213 $ 100,000 — —
Stockholders' Equity (including discontinued operations) $ 1,890,784 $ 1,827,917 $ 1,845,578 $ 1,618,313 $ 1,405,297
Return on Average Stockholders' Equity(6) 8% 0% 16% 31% 35%
Comparable Store Sales(7) 7% (23)% (13)% (1)% 1%
Net Retail Sales Per Average Gross Square Foot $ 390 $ 339 $ 432 $ 503 $ 509
Stores at End of Year and Average Associates
Total Number of Stores Open 1,069 1,096 1,097 1,013 930
Gross Square Feet 7,756 7,848 7,760 7,133 6,563
Average Number of Associates(8) 83,000 83,000 96,200 94,600 80,100
(1) Fiscal 2006 was a fifty-three week year.
(2) Includes results of operations from RUEHL branded stores and related direct-to-consumer operations. Results from discontinued
operations were immaterial in Fiscal 2010.
31