Abercrombie & Fitch 2010 Annual Report Download - page 38
Download and view the complete annual report
Please find page 38 of the 2010 Abercrombie & Fitch annual report below. You can navigate through the pages in the report by either clicking on the pages listed below, or by using the keyword search tool below to find specific information within the annual report.-
 1
1 -
2
-
3
-
4
-
5
-
6
-
7
-
8
-
9
-
10
-
11
-
12
-
13
-
14
-
15
-
16
-
17
-
18
-
19
-
20
-
21
-
22
-
23
-
24
-
25
-
26
-
27
-
 28
28 -
 29
29 -
 30
30 -
 31
31 -
 32
32 -
 33
33 -
 34
34 -
 35
35 -
 36
36 -
 37
37 -
 38
38 -
 39
39 -
 40
40 -
 41
41 -
 42
42 -
 43
43 -
 44
44 -
 45
45 -
 46
46 -
 47
47 -
 48
48 -
49
-
50
-
51
-
52
-
53
-
54
-
55
-
56
-
57
-
58
-
59
-
60
-
61
-
62
-
63
-
64
-
65
-
66
-
67
-
68
-
69
-
70
-
71
-
72
-
73
-
74
-
75
-
76
-
77
-
78
-
79
-
80
-
81
-
82
-
83
-
84
-
85
-
86
-
87
-
88
-
89
-
90
-
91
-
92
-
93
-
94
-
95
-
96
-
97
-
98
-
99
-
100
-
101
-
102
-
103
-
104
-
105
-
106
-
107
-
108
-
109
-
110
-
111
-
112
-
113
-
114
-
115
-
116
-
117
-
118
-
119
-
120
-
121
-
122
-
123
-
124
-
125
-
126
-
127
-
128
-
129
-
130
-
131
-
132
-
133
-
134
-
135
-
136
-
137
-
138
-
139
-
140
 |
 |
Table of Contents
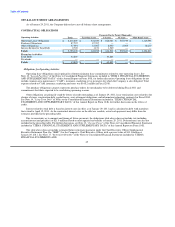
FINANCIAL SUMMARY
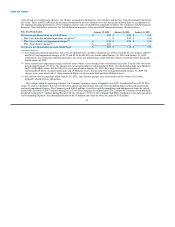
The following summarized financial and statistical data compares Fiscal 2010 to Fiscal 2009 and Fiscal 2009 to Fiscal 2008:
2010 2009 2008
Net sales by brand (thousands) $ 3,468,777 $ 2,928,626 $ 3,484,058
Abercrombie & Fitch $ 1,493,101 $ 1,272,287 $ 1,531,480
abercrombie $ 382,579 $ 343,164 $ 420,518
Hollister $ 1,552,814 $ 1,287,241 $ 1,514,204
Gilly Hicks** $ 40,283 $ 25,934 $ 17,856
Increase (decrease) in net sales from prior year 18% (16)% (6)%
Abercrombie & Fitch 17% (17)% (7)%
abercrombie 11% (18)% (11)%
Hollister 21% (15)% (5)%
Gilly Hicks 55% 45% NM
Increase (decrease) in comparable store sales* 7% (23)% (13)%
Abercrombie & Fitch 9% (19)% (8)%
abercrombie 5% (23)% (19)%
Hollister 6% (27)% (17)%
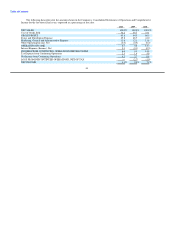
Net store sales per average store (in thousands) $ 2,796 $ 2,412 $ 3,041
Abercrombie & Fitch $ 3,772 $ 3,193 $ 3,878
abercrombie $ 1,616 $ 1,453 $ 1,823
Hollister $ 2,638 $ 2,299 $ 2,962
Net store sales per average gross square foot $ 390 $ 339 $ 432
Abercrombie & Fitch $ 419 $ 359 $ 438
abercrombie $ 342 $ 313 $ 397
Hollister $ 384 $ 338 $ 442
Change in transactions per average store 17% (14)% (16)%
Abercrombie & Fitch 15% (14)% (11)%
abercrombie 13% (14)% (20)%
Hollister 17% (16)% (18)%
Change in average store transaction value (1)% (7)% 2%
Abercrombie & Fitch 3% (4)% 5%
abercrombie (1)% (7)% 1%
Hollister (2)% (8)% 1%
Change in average units per store transaction 8% 0% 0%
Abercrombie & Fitch 7% (2)% 0%
abercrombie 11% (1)% (2)%
Hollister 7% 0% (1)%
Change in average unit retail sold, including DTC (9)% (7)% 2%
Abercrombie & Fitch (5)% (2)% 5%
abercrombie (12)% (7)% 3%
Hollister (9)% (8)% 1%
* A store is included in comparable store sales when it has been open as the same brand 12 months or more and its square footage
has not been expanded or reduced by more than 20% within the past year.
** Net sales for the fifty-two week periods ended January 29, 2011, January 30, 2010 and January 31, 2009 reflect the activity of
19, 16 and 14 stores, respectively. Operational data was deemed immaterial for inclusion in the table above.
35