Abercrombie & Fitch 2010 Annual Report Download - page 35
Download and view the complete annual report
Please find page 35 of the 2010 Abercrombie & Fitch annual report below. You can navigate through the pages in the report by either clicking on the pages listed below, or by using the keyword search tool below to find specific information within the annual report.-
 1
1 -
2
-
3
-
4
-
5
-
6
-
7
-
8
-
9
-
10
-
11
-
12
-
13
-
14
-
15
-
16
-
17
-
18
-
19
-
20
-
21
-
22
-
23
-
24
-
 25
25 -
 26
26 -
 27
27 -
 28
28 -
 29
29 -
 30
30 -
 31
31 -
 32
32 -
 33
33 -
 34
34 -
 35
35 -
 36
36 -
 37
37 -
 38
38 -
 39
39 -
 40
40 -
 41
41 -
 42
42 -
 43
43 -
 44
44 -
 45
45 -
46
-
47
-
48
-
49
-
50
-
51
-
52
-
53
-
54
-
55
-
56
-
57
-
58
-
59
-
60
-
61
-
62
-
63
-
64
-
65
-
66
-
67
-
68
-
69
-
70
-
71
-
72
-
73
-
74
-
75
-
76
-
77
-
78
-
79
-
80
-
81
-
82
-
83
-
84
-
85
-
86
-
87
-
88
-
89
-
90
-
91
-
92
-
93
-
94
-
95
-
96
-
97
-
98
-
99
-
100
-
101
-
102
-
103
-
104
-
105
-
106
-
107
-
108
-
109
-
110
-
111
-
112
-
113
-
114
-
115
-
116
-
117
-
118
-
119
-
120
-
121
-
122
-
123
-
124
-
125
-
126
-
127
-
128
-
129
-
130
-
131
-
132
-
133
-
134
-
135
-
136
-
137
-
138
-
139
-
140
 |
 |

Table of Contents
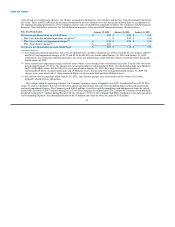
(3) Return on Average Assets is computed by dividing net income (including discontinued operations) by the average asset balance
(including discontinued operations).
(4) Working Capital is computed by subtracting current liabilities (including discontinued operations) from current assets (including
discontinued operations).
(5) Current Ratio is computed by dividing current assets (including discontinued operations) by current liabilities (including
discontinued operations).
(6) Return on Average Stockholders' Equity is computed by dividing net income (including discontinued operations) by the average
stockholders' equity balance (including discontinued operations).
(7) A store is included in comparable store sales when it has been open as the same brand at least one year and its square footage has
not been expanded or reduced by more than 20% within the past year. Note Fiscal 2006 comparable store sales are compared to
store sales for the comparable fifty-three weeks ended February 4, 2006.
(8) Includes employees from RUEHL operations.
ITEM 7. MANAGEMENT'S DISCUSSION AND ANALYSIS OF FINANCIAL CONDITION AND RESULTS OF
OPERATIONS
OVERVIEW
The Company's fiscal year ends on the Saturday closest to January 31, typically resulting in a fifty-two week year, but
occasionally giving rise to an additional week, resulting in a fifty-three week year. A store is included in comparable store sales when
it has been open as the same brand at least one year and its square footage has not been expanded or reduced by more than 20% within
the past year.
For purposes of this "ITEM 7. MANAGEMENT'S DISCUSSION AND ANALYSIS OF FINANCIAL CONDITION AND
RESULTS OF OPERATIONS," the fifty-two week period ended January 29, 2011 is compared to the fifty-two week period ended
January 30, 2010 and the fifty-two week period ended January 30, 2010 is compared to the fifty-two week period ended January 31,
2009.
The Company had net sales of $3.469 billion for the fifty-two weeks ended January 29, 2011, up 18.4% from $2.929 billion for
the fifty-two weeks ended January 30, 2010. Operating income for Fiscal 2010 was $231.9 million, which was up from $117.9 million
in Fiscal 2009. Net income from continuing operations was $150.3 million and net income per diluted share from continuing
operations was $1.67 in Fiscal 2010, compared to net income from continuing operations of $79.0 million and net income per diluted
share from continuing operations of $0.89 in Fiscal 2009.
Net income was $150.3 million and net income per diluted share was $1.67 in Fiscal 2010, compared to net income of
$0.3 million and net income per diluted share of $0.00 in Fiscal 2009.
Excluding store-related asset impairment charges and exit charges associated with domestic store closures, the Company
reported non-GAAP net income per diluted share of $2.05 for the fifty-two weeks ended January 29, 2011. Excluding the net loss
from discontinued operations and store-related asset impairment charges, the Company reported non-GAAP net income per diluted
share of $1.12 for the fifty-two weeks ended January 30, 2010.
The Company believes that the non-GAAP financial measures are useful to investors as they provide the ability to measure the
Company's operating performance and compare it against that of prior periods without reference to the Consolidated Statements of
Operations and Comprehensive Income impact of non-cash
32