Abercrombie & Fitch 2010 Annual Report Download - page 74
Download and view the complete annual report
Please find page 74 of the 2010 Abercrombie & Fitch annual report below. You can navigate through the pages in the report by either clicking on the pages listed below, or by using the keyword search tool below to find specific information within the annual report.-
 1
1 -
2
-
3
-
4
-
5
-
6
-
7
-
8
-
9
-
10
-
11
-
12
-
13
-
14
-
15
-
16
-
17
-
18
-
19
-
20
-
21
-
22
-
23
-
24
-
25
-
26
-
27
-
28
-
29
-
30
-
31
-
32
-
33
-
34
-
35
-
36
-
37
-
38
-
39
-
40
-
41
-
42
-
43
-
44
-
45
-
46
-
47
-
48
-
49
-
50
-
51
-
52
-
53
-
54
-
55
-
56
-
57
-
58
-
59
-
60
-
61
-
62
-
63
-
 64
64 -
 65
65 -
 66
66 -
 67
67 -
 68
68 -
 69
69 -
 70
70 -
 71
71 -
 72
72 -
 73
73 -
 74
74 -
 75
75 -
 76
76 -
 77
77 -
 78
78 -
 79
79 -
 80
80 -
 81
81 -
 82
82 -
 83
83 -
 84
84 -
85
-
86
-
87
-
88
-
89
-
90
-
91
-
92
-
93
-
94
-
95
-
96
-
97
-
98
-
99
-
100
-
101
-
102
-
103
-
104
-
105
-
106
-
107
-
108
-
109
-
110
-
111
-
112
-
113
-
114
-
115
-
116
-
117
-
118
-
119
-
120
-
121
-
122
-
123
-
124
-
125
-
126
-
127
-
128
-
129
-
130
-
131
-
132
-
133
-
134
-
135
-
136
-
137
-
138
-
139
-
140
 |
 |

Table of Contents
ABERCROMBIE & FITCH CO.
NOTES TO CONSOLIDATED FINANCIAL STATEMENTS — (Continued)
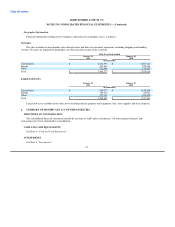
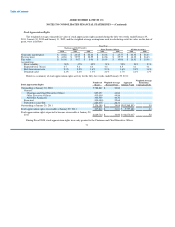
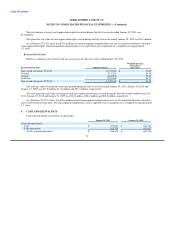
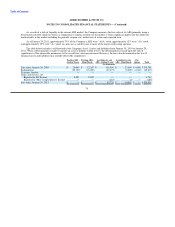
Stock Appreciation Rights
The weighted-average estimated fair value of stock appreciation rights granted during the fifty-two weeks ended January 29,
2011, January 30, 2010 and January 31, 2009, and the weighted-average assumptions used in calculating such fair value, on the date of
grant, were as follows:
Fiscal Year
Chairman and Chief Executive
Officer Other Executive Officers All Other Associates
2010 2009 2008 2010 2009 2010 2009
Grant date market price $ 44.86 $ 28.42 $ 22.84 $ 44.86 $ 25.77 $ 44.32 $ 26.43
Exercise price $ 44.86 $ 32.99 $ 28.55 $ 44.86 $ 25.77 $ 44.32 $ 26.43
Fair value $ 16.96 $ 9.67 $ 8.06 $ 16.99 $ 10.06 $ 16.51 $ 10.00
Assumptions:
Price volatility 50% 47% 45% 51% 52% 53% 53%
Expected term (Years) 4.7 5.6 6.4 4.5 4.5 4.1 4.1
Risk-free interest rate 2.3% 2.5% 1.6% 2.3% 1.6% 2.0% 1.6%
Dividend yield 2.1% 2.4% 1.3% 2.1% 1.7% 2.1% 1.7%
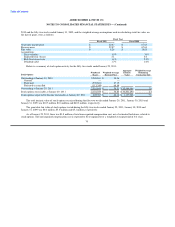
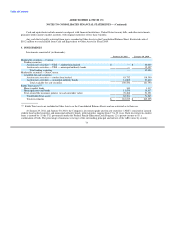
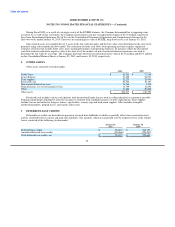
Below is a summary of stock appreciation rights activity for the fifty-two weeks ended January 29, 2011:
Weighted-Average
Number of Weighted-Average Aggregate Remaining
Stock Appreciation Rights Shares Exercise Price Intrinsic Value Contractual Life
Outstanding at January 30, 2010 5,788,867 $ 30.88
Granted:
Chairman and Chief Executive Officer 829,697 44.86
Other Executive Officers 435,000 44.86
All Other Associates 306,500 44.32
Exercised (100,400) 25.68
Forfeited or cancelled (123,475) 26.31
Outstanding at January 29, 2011 7,136,189 $ 34.08 $103,568,853 5.8
Stock appreciation rights exercisable at January 29, 2011 347,816 $ 31.81 $ 5,757,482 6.3
Stock appreciation rights expected to become exercisable at January 29,
2011 6,669,714 $ 34.00 $ 96,670,417 5.8
During Fiscal 2008, stock appreciation rights were only granted to the Chairman and Chief Executive Officer.
71