Abercrombie & Fitch 2010 Annual Report Download - page 40
Download and view the complete annual report
Please find page 40 of the 2010 Abercrombie & Fitch annual report below. You can navigate through the pages in the report by either clicking on the pages listed below, or by using the keyword search tool below to find specific information within the annual report.-
 1
1 -
2
-
3
-
4
-
5
-
6
-
7
-
8
-
9
-
10
-
11
-
12
-
13
-
14
-
15
-
16
-
17
-
18
-
19
-
20
-
21
-
22
-
23
-
24
-
25
-
26
-
27
-
28
-
29
-
 30
30 -
 31
31 -
 32
32 -
 33
33 -
 34
34 -
 35
35 -
 36
36 -
 37
37 -
 38
38 -
 39
39 -
 40
40 -
 41
41 -
 42
42 -
 43
43 -
 44
44 -
 45
45 -
 46
46 -
 47
47 -
 48
48 -
 49
49 -
 50
50 -
51
-
52
-
53
-
54
-
55
-
56
-
57
-
58
-
59
-
60
-
61
-
62
-
63
-
64
-
65
-
66
-
67
-
68
-
69
-
70
-
71
-
72
-
73
-
74
-
75
-
76
-
77
-
78
-
79
-
80
-
81
-
82
-
83
-
84
-
85
-
86
-
87
-
88
-
89
-
90
-
91
-
92
-
93
-
94
-
95
-
96
-
97
-
98
-
99
-
100
-
101
-
102
-
103
-
104
-
105
-
106
-
107
-
108
-
109
-
110
-
111
-
112
-
113
-
114
-
115
-
116
-
117
-
118
-
119
-
120
-
121
-
122
-
123
-
124
-
125
-
126
-
127
-
128
-
129
-
130
-
131
-
132
-
133
-
134
-
135
-
136
-
137
-
138
-
139
-
140
 |
 |

Table of Contents
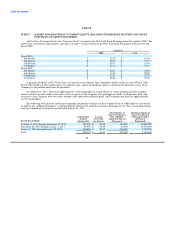
The following measurements are among the key business indicators reviewed by various members of management to gauge the
Company's results:
• Comparable store sales by brand, by product, and by store, defined as year-over-year sales for a store that has been open as the
same brand at least one year and its square footage has not been expanded or reduced by more than 20% within the past year;
• Direct-to-consumer sales growth;
• International, and domestic and flagship store performance;
• Store productivity;
• Initial Mark Up ("IMU");
• Markdown rate;
• Gross profit rate;
• Selling margin, defined as sales price less original cost, by brand and by product category;
• Stores and distribution expense as a percentage of net sales;
• Marketing, general and administrative expense as a percentage of net sales;
• Operating income and operating income as a percentage of net sales;
• Net income;
• Inventory per gross square foot;
• Cash flow and liquidity determined by the Company's current ratio and cash provided by operations; and
• Store metrics such as sales per gross square foot, sales per selling square foot, average unit retail, average number of
transactions per store, average transaction values, store contribution (defined as store sales less direct costs of running the
store), and average units per transaction.
While not all of these metrics are disclosed publicly by the Company due to the proprietary nature of the information, the
Company publicly discloses and discusses many of these metrics as part of its "Financial Summary" and in several sections within this
Management's Discussion and Analysis of Financial Condition and Results of Operations.
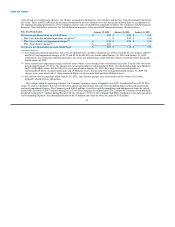
FISCAL 2010 COMPARED TO FISCAL 2009
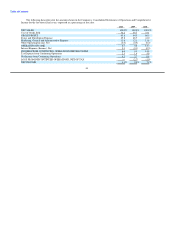
Net Sales
Net sales for Fiscal 2010 were $3.469 billion, an increase of 18% from Fiscal 2009 net sales of $2.929 billion. The net sales
increase was attributable to a 7% increase in comparable store sales, a 40% increase in the direct-to-consumer business, including
shipping and handling revenue, and new stores, primarily international. The impact of foreign currency on sales for Fiscal 2010 and
Fiscal 2009 was less than 1% of net sales.
Comparable store sales by brand for Fiscal 2010 were as follows: Abercrombie & Fitch increased 9%, with women's increasing
by a high single digit percent and men's increasing by a low double digit.
37