2K Sports 2003 Annual Report Download - page 48
Download and view the complete annual report
Please find page 48 of the 2003 2K Sports annual report below. You can navigate through the pages in the report by either clicking on the pages listed below, or by using the keyword search tool below to find specific information within the annual report.-
 1
1 -
2
-
3
-
4
-
5
-
6
-
7
-
8
-
9
-
10
-
11
-
12
-
13
-
14
-
15
-
16
-
17
-
18
-
19
-
20
-
21
-
22
-
23
-
24
-
25
-
26
-
27
-
28
-
29
-
30
-
31
-
32
-
33
-
34
-
35
-
36
-
37
-
 38
38 -
 39
39 -
 40
40 -
 41
41 -
 42
42 -
 43
43 -
 44
44 -
 45
45 -
 46
46 -
 47
47 -
 48
48 -
 49
49 -
 50
50 -
 51
51 -
 52
52 -
 53
53 -
 54
54
 |
 |

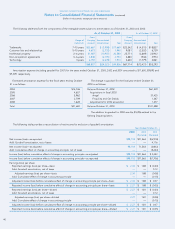
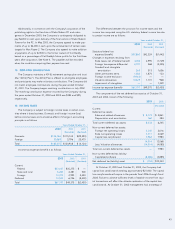
19. RESULTS BY QUARTER (UNAUDITED)
The following tables set forth restated quarterly supplementary data for each of the years in the two-year period ended October 31, 2003.
The unaudited quarterly results of operations for each of the quarters in the fiscal year ended October 31, 2002 and for each of the three
quarters in the period ended July 31, 2003 have been restated for the revised revenue recognition policy related to the change in the method
of accounting for price concessions identified in Note 2.
1st 2nd 3rd 4th
Quarter Quarter Quarter Quarter
2003 (Restated) (Restated) (Restated)
Net sales $411,008 $193,023 $152,055 $277,607
Gross profit 165,947 71,483 58,519 100,190
Net income $ 51,535 $ 14,623 $5,696 $ 26,264
Per share data:
Basic—EPS $ 1.26 $ 0.35 $ 0.13 $ 0.60
Diluted—EPS $ 1.22 $ 0.35 $ 0.13 $ 0.58
As Restated
2002
Net sales $286,945 $167,286 $123,117 $217,328
Gross profit 106,242 60,642 45,997 81,711
Net income $ 36,752 $ 8,010 $ 5,049 $ 21,752
Per share data:
Basic—EPS $ 1.00 $ 0.22 $ 0.13 $ 0.55
Diluted—EPS $ 0.97 $ 0.21 $ 0.13 $ 0.53
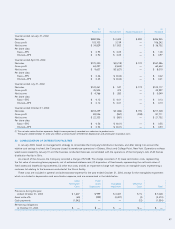
The following table summarizes the increase (decrease) in the results of operations for the reported 2003 and 2002 fiscal quarters as a result
of the restatement discussed above:
As As
Reported Restatement Restated
Quarter ended January 31, 2003:
Net sales $408,794 $ 2,214 $411,008
Gross profit 164,127 1,820 165,947
Net income $ 50,462 $ 1,073 $ 51,535
Per share data:
Basic—EPS $ 1.24 $ 0.02 $ 1.26
Diluted—EPS $ 1.20 $ 0.02 $ 1.22
Quarter ended April 30, 2003:
Net sales $194,213 $(1,190) $193,023
Gross profit 72,474 (991) 71,483
Net income $ 15,239 $ (616) $ 14,623
Per share data:
Basic—EPS $ 0.37 $ (0.02) $ 0.35
Diluted—EPS $ 0.36 $ (0.01) $ 0.35
Quarter ended July 31, 2003:
Net sales $155,587 $(3,532) $152,055
Gross profit 61,669 (3,150) 58,519
Net income $ 7,649 $(1,953) $ 5,696
Per share data:
Basic—EPS $ 0.18 $ (0.05) $ 0.13
Diluted—EPS $ 0.18 $ (0.05) $ 0.13
TAKE-TWO INTERACTIVE SOFTWARE, INC. AND SUBSIDIARIES
Notes to Consolidated Financial Statements (continued)
(Dollars in thousands, except per share amounts)
46