2K Sports 2003 Annual Report Download - page 3
Download and view the complete annual report
Please find page 3 of the 2003 2K Sports annual report below. You can navigate through the pages in the report by either clicking on the pages listed below, or by using the keyword search tool below to find specific information within the annual report.-
 1
1 -
 2
2 -
 3
3 -
 4
4 -
 5
5 -
 6
6 -
 7
7 -
 8
8 -
 9
9 -
 10
10 -
 11
11 -
 12
12 -
 13
13 -
 14
14 -
15
-
16
-
17
-
18
-
19
-
20
-
21
-
22
-
23
-
24
-
25
-
26
-
27
-
28
-
29
-
30
-
31
-
32
-
33
-
34
-
35
-
36
-
37
-
38
-
39
-
40
-
41
-
42
-
43
-
44
-
45
-
46
-
47
-
48
-
49
-
50
-
51
-
52
-
53
-
54
 |
 |

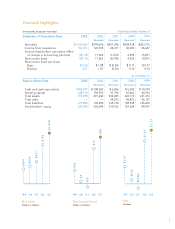
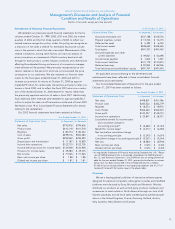
Financial Highlights
(In thousands, except per share data) Fiscal Years Ended October 31
Statement of Operations Data: 2003 2002 2001 2000 1999
(Restated) (Restated) (Restated) (Restated)
Net sales $1,033,693 $794,676 $451,396 $358,918 $303,715
Income from operations 163,011 122,705 28,377 30,250 26,627
Income (loss) before cumulative effect
of change in accounting principle 98,118 71,563 (1,674) 4,555 15,871
Net income (loss) 98,118 71,563 (6,918) 4,555 15,871
Net income (loss) per share
Basic $ 2.34 $ 1.88 $ (0.20) $ 0.17 $ 0.77
Diluted 2.27 1.81 (0.20) 0.16 0.74
As of October 31
Balance Sheet Data: 2003 2002 2001 2000 1999
(Restated) (Restated) (Restated) (Restated)
Cash and cash equivalents $183,477 $ 108,369 $ 6,056 $ 5,245 $ 10,374
Working capital 348,155 196,555 91,794 65,663 40,743
Total assets 707,298 491,440 354,305 326,173 231,016
Total debt —— 54,073 96,873 56,137
Total liabilities 173,806 135,896 135,140 158,538 146,609
Stockholders’ equity. 533,492 355,544 219,165 167,634 84,407
Net Income (Loss)
(Dollars in millions)
Net Sales
(Dollars in millions)
EPS
(Diluted)
1
$16
'99
$5
$(7)
$72
$98
'00 '01 '02 '03
$1,034
$795
$451
$359
$304
'99 '00 '01 '02 '03
$0.16
$0.74
$(0.20)
$1.81
$2.27
'00 '01 '02 '03'99