Westjet 2010 Annual Report Download - page 91
Download and view the complete annual report
Please find page 91 of the 2010 Westjet annual report below. You can navigate through the pages in the report by either clicking on the pages listed below, or by using the keyword search tool below to find specific information within the annual report.-
 1
1 -
2
-
3
-
4
-
5
-
6
-
7
-
8
-
9
-
10
-
11
-
12
-
13
-
14
-
15
-
16
-
17
-
18
-
19
-
20
-
21
-
22
-
23
-
24
-
25
-
26
-
27
-
28
-
29
-
30
-
31
-
32
-
33
-
34
-
35
-
36
-
37
-
38
-
39
-
40
-
41
-
42
-
43
-
44
-
45
-
46
-
47
-
48
-
49
-
50
-
51
-
52
-
53
-
54
-
55
-
56
-
57
-
58
-
59
-
60
-
61
-
62
-
63
-
64
-
65
-
66
-
67
-
68
-
69
-
70
-
71
-
72
-
73
-
74
-
75
-
76
-
77
-
78
-
79
-
80
-
 81
81 -
 82
82 -
 83
83 -
 84
84 -
 85
85 -
 86
86 -
 87
87 -
 88
88 -
 89
89 -
 90
90 -
 91
91 -
 92
92 -
 93
93 -
 94
94 -
 95
95 -
 96
96 -
 97
97 -
 98
98
 |
 |

WestJet 2010 Annual Report 89
NOTES TO CONSOLIDATED
FINANCIAL STATEMENTS
For the years ended December 31, 2010 and 2009
(Stated in thousands of Canadian dollars,
except share and per share amounts)
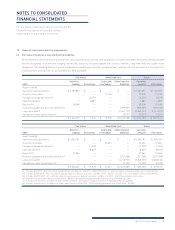
13. Financial instruments and risk management (continued)
(c) Risk management (continued)
Fuel risk (continued)
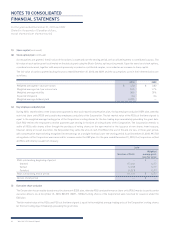
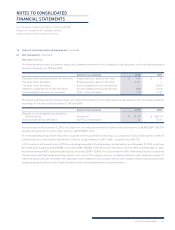
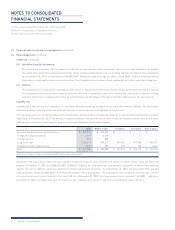
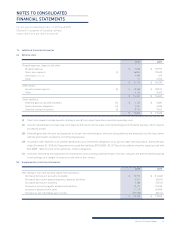
The following table presents the fi nancial impact and statement presentation of the Corporation’s fuel derivatives on the consolidated balance
sheet as at December 31, 2010 and 2009:
Statement presentation 2010 2009
Receivable from counterparties for fuel derivatives Prepaid expenses, deposits and other $ 445 $ 96
Fair value of fuel derivatives Prepaid expenses, deposits and other 5,244 —
Fair value of fuel derivatives Accounts payable and accrued liabilities — (7,521)
Payable to counterparties for fuel derivatives Accounts payable and accrued liabilities (800) (1,242)
Unrealized (gain) loss from fuel derivatives AOCL – before tax impact (11) 6,713
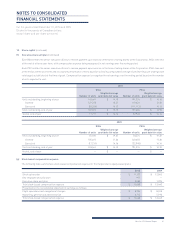
Statement presentation 2010 2009
Realized loss on designated fuel derivatives –
effective portion Aircraft fuel $ (9,172) $ (28,411)
Gain on designated fuel derivatives Gain (loss) on derivatives 44 5,617
The following table presents the fi nancial impact and statement presentation of the Corporation’s fuel derivatives on the consolidated statement
of earnings for the years ended December 31, 2010 and 2009:
During the year ended December 31, 2010, the Corporation net settled fuel derivatives in favour of the counterparties of $8,980 (2009 – $29,574)
and paid cash premiums for option-style contracts of $6,189 (2009 – $nil).
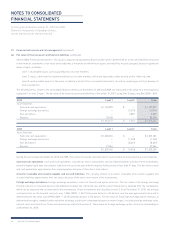
The estimated amount reported in AOCL that is expected to be reclassifi ed to net earnings as a component of aircraft fuel expense, when the
underlying jet fuel is consumed during the next 12 months, is a gain before tax of $11 (2009 – loss before tax of $6,713).
A 10% increase in the forward curve for WTI, the underlying commodity of the Corporation’s fuel derivatives, as at December 31, 2010, would have
decreased AOCL by approximately $4,896, net of taxes (2009 – $3,583). A 10% decrease in the forward curve for WTI, as at December 31, 2010,
would have increased AOCL by approximately $2,455, net of taxes (2009 – $3,814). This is assuming that 100% of the change in price is considered
effective under cash fl ow hedge accounting. Should some or all of the change in price be considered ineffective under hedge accounting, the
ineffective portion would be recorded in non-operating income (expense). It also assumes that all other variables remain constant, particularly
foreign exchange and interest rates. These assumptions may not be representative of actual movements.