Westjet 2010 Annual Report Download - page 19
Download and view the complete annual report
Please find page 19 of the 2010 Westjet annual report below. You can navigate through the pages in the report by either clicking on the pages listed below, or by using the keyword search tool below to find specific information within the annual report.-
 1
1 -
2
-
3
-
4
-
5
-
6
-
7
-
8
-
 9
9 -
 10
10 -
 11
11 -
 12
12 -
 13
13 -
 14
14 -
 15
15 -
 16
16 -
 17
17 -
 18
18 -
 19
19 -
 20
20 -
 21
21 -
 22
22 -
 23
23 -
 24
24 -
 25
25 -
 26
26 -
 27
27 -
 28
28 -
 29
29 -
30
-
31
-
32
-
33
-
34
-
35
-
36
-
37
-
38
-
39
-
40
-
41
-
42
-
43
-
44
-
45
-
46
-
47
-
48
-
49
-
50
-
51
-
52
-
53
-
54
-
55
-
56
-
57
-
58
-
59
-
60
-
61
-
62
-
63
-
64
-
65
-
66
-
67
-
68
-
69
-
70
-
71
-
72
-
73
-
74
-
75
-
76
-
77
-
78
-
79
-
80
-
81
-
82
-
83
-
84
-
85
-
86
-
87
-
88
-
89
-
90
-
91
-
92
-
93
-
94
-
95
-
96
-
97
-
98
 |
 |

WestJet 2010 Annual Report 17
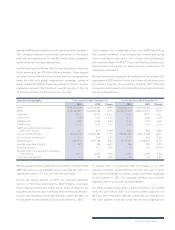
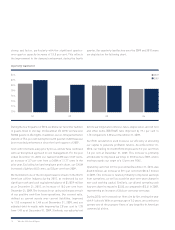
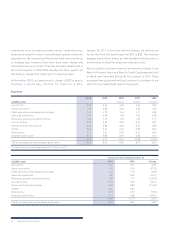
During 2010, total revenues increased by 14.4 per cent to
$2,609.3 million from $2,281.1 million in 2009. The increase in
revenues is primarily attributable to the increased capacity since
the prior year, along with positive variances in both load factor and
yield. Our traffic growth of 12.9 per cent outpaced our 11.1 per cent
capacity growth during the year. One of our key revenue
measurements is RASM, as it takes into consideration load factor
and yield. Our RASM increased by 3.0 per cent to 13.36 cents
for 2010, compared to 12.97 cents in 2009. Average stage length
growth of 4.9 per cent from 2009 placed downward pressure on
RASM. As average stage length increases, revenue per available
seat mile typically decreases. Despite the growth in stage length
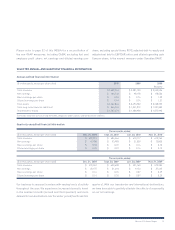
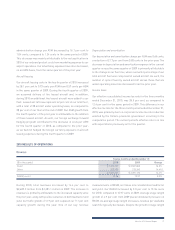
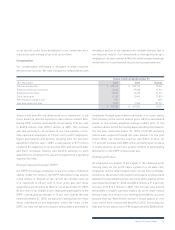
2010 RESULTS OF OPERATIONS
Revenue
Twelve months ended December 31
($ in thousands) 2010 2009 Change
Guest $ 2,405,281 $ 2,067,860 16.3%
Other 203,980 213,260 (4.4%)
$ 2,609,261 $ 2,281,120 14.4%
RASM (cents) 13.36 12.97 3.0%
administration charge per ASM decreased by 16.1 per cent to
1.04 cents, compared to 1.24 cents in the same period of 2009.
This decrease was mainly attributable to the reclassification in
2010 of our onboard product costs from marketing expense to our
airport operations. Our advertising expenses have also decreased,
on an ASM basis, from the same quarter of the prior year.
Aircraft leasing
Our aircraft leasing costs in the fourth quarter of 2010 increased
by 28.1 per cent to 0.73 cents per ASM from 0.57 cents per ASM
in the same quarter of 2009. During the fourth quarter of 2009,
we assumed delivery of five leased aircraft and, in addition,
during 2010 an additional five leased aircraft were added to our
fleet. Leased aircraft now represent 42 per cent of our total fleet,
with a total of 38 aircraft under operating lease, as compared to
38 per cent of our fleet at the end of 2009. Our ASM growth from
the fourth quarter of the prior year is attributable to the addition
of these leased aircraft. As well, our foreign exchange forward
hedging program contributed to the decrease in costs per ASM
for the fourth quarter of 2010, as compared to the prior year,
as we had not hedged the foreign currency exposure on aircraft
leasing expenses during the fourth quarter of 2009.
Depreciation and amortization
Our depreciation and amortization charge per ASM was 0.65 cents,
a reduction of 21.7 per cent from 0.83 cents in the prior year. The
decrease in depreciation and amortization expense in the current
quarter versus the same quarter of 2009 is primarily attributable
to the change in our fleet mix, where a smaller percentage of our
total aircraft fleet was comprised of owned aircraft. As such, the
number of cycles flown by owned aircraft versus those that are
under operating lease has decreased from the prior year.
Income taxes
Our effective consolidated income tax rate for the three months
ended December 31, 2010, was 28.5 per cent, as compared to
12.4 per cent for the same period in 2009. This difference in our
effective tax rate for the three month period ended December 31,
2010, was primarily due to a corporate income tax rate reduction
enacted by the Ontario provincial government occurring in the
comparative period. The current period’s effective rate is in line
with expectations previously set for the quarter.