Westjet 2010 Annual Report Download - page 20
Download and view the complete annual report
Please find page 20 of the 2010 Westjet annual report below. You can navigate through the pages in the report by either clicking on the pages listed below, or by using the keyword search tool below to find specific information within the annual report.-
 1
1 -
2
-
3
-
4
-
5
-
6
-
7
-
8
-
9
-
 10
10 -
 11
11 -
 12
12 -
 13
13 -
 14
14 -
 15
15 -
 16
16 -
 17
17 -
 18
18 -
 19
19 -
 20
20 -
 21
21 -
 22
22 -
 23
23 -
 24
24 -
 25
25 -
 26
26 -
 27
27 -
 28
28 -
 29
29 -
 30
30 -
31
-
32
-
33
-
34
-
35
-
36
-
37
-
38
-
39
-
40
-
41
-
42
-
43
-
44
-
45
-
46
-
47
-
48
-
49
-
50
-
51
-
52
-
53
-
54
-
55
-
56
-
57
-
58
-
59
-
60
-
61
-
62
-
63
-
64
-
65
-
66
-
67
-
68
-
69
-
70
-
71
-
72
-
73
-
74
-
75
-
76
-
77
-
78
-
79
-
80
-
81
-
82
-
83
-
84
-
85
-
86
-
87
-
88
-
89
-
90
-
91
-
92
-
93
-
94
-
95
-
96
-
97
-
98
 |
 |

18 WestJet 2010 Annual Report
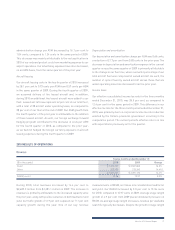
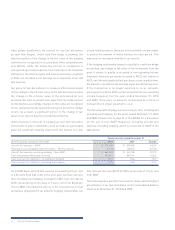
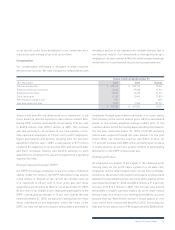
and the significant increase in ASMs year over year, we saw an
improvement in load factor of 1.2 points, as well as an improvement
in yield of 1.3 per cent year over year.
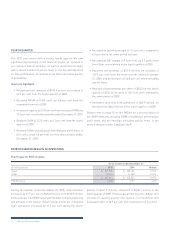
Beginning in the third quarter of 2010, we realized year over year
yield increases, driven heavily by strong domestic market
performance over the busy summer months. Throughout the
fourth quarter, we continued to experience strong yields across
our network. This trend is encouraging, as it is an indication that
the demand environment is improving.
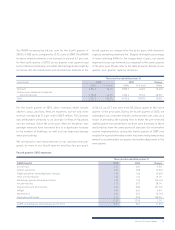
At the end of the second quarter of 2010, we adjusted our
fare structure to offer everyday low fares, with the objective of
encouraging guests to purchase flights when they are ready to
book, rather than waiting for a seat sale. Our top-end fares were
reduced by an average of 25 per cent, designed to offer excellent
value for guests who need to book close to departure date.
The volume of guests booking in these higher fare classes has
grown significantly year over year. We believe that our new fare
structure provides our guests with value and has contributed to
our overall yield improvement.
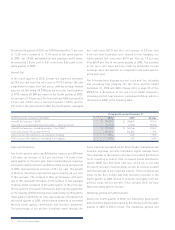
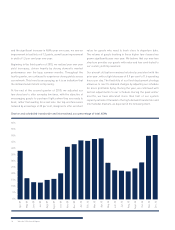
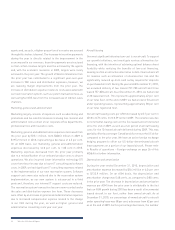
Our aircraft utilization remained relatively consistent with the
prior year, with a slight decrease of 0.9 per cent to 11.6 operating
hours per day. The flexibility of our fleet deployment strategy
allows us to react to demand changes by adjusting our schedule
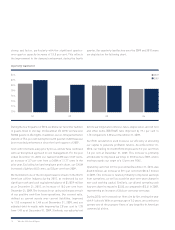
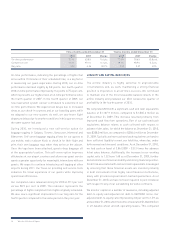
for more profitable flying. During the year, we continued with
tactical adjustments to our schedule. During the peak winter
months, we have allocated more than half of our system
capacity outside of Canada to the high-demand transborder and
international markets, as depicted in the following chart.
Charter and scheduled transborder and international as a percentage of total ASMs
Apr. 09
May 09
Jun. 09
Jul. 09
Aug. 09
Sept. 09
Oct. 09
Nov. 09
Dec. 09
Jan. 10
Feb. 10
Mar. 10
Apr. 10
May 10
Jun. 10
Jul. 10
Aug. 10
Sept. 10
Oct. 10
Nov. 10
Dec. 10
60%
55%
50%
45%
40%
35%
30%
25%
20%
15%
10%
5%
0%