Westjet 2010 Annual Report Download - page 17
Download and view the complete annual report
Please find page 17 of the 2010 Westjet annual report below. You can navigate through the pages in the report by either clicking on the pages listed below, or by using the keyword search tool below to find specific information within the annual report.-
 1
1 -
2
-
3
-
4
-
5
-
6
-
 7
7 -
 8
8 -
 9
9 -
 10
10 -
 11
11 -
 12
12 -
 13
13 -
 14
14 -
 15
15 -
 16
16 -
 17
17 -
 18
18 -
 19
19 -
 20
20 -
 21
21 -
 22
22 -
 23
23 -
 24
24 -
 25
25 -
 26
26 -
 27
27 -
28
-
29
-
30
-
31
-
32
-
33
-
34
-
35
-
36
-
37
-
38
-
39
-
40
-
41
-
42
-
43
-
44
-
45
-
46
-
47
-
48
-
49
-
50
-
51
-
52
-
53
-
54
-
55
-
56
-
57
-
58
-
59
-
60
-
61
-
62
-
63
-
64
-
65
-
66
-
67
-
68
-
69
-
70
-
71
-
72
-
73
-
74
-
75
-
76
-
77
-
78
-
79
-
80
-
81
-
82
-
83
-
84
-
85
-
86
-
87
-
88
-
89
-
90
-
91
-
92
-
93
-
94
-
95
-
96
-
97
-
98
 |
 |

WestJet 2010 Annual Report 15
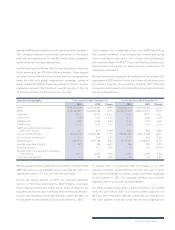
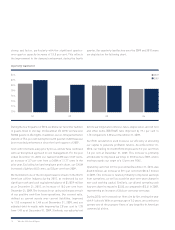
Our RASM increased by 6.8 per cent for the fourth quarter of
2010 to 13.80 cents, compared to 12.92 cents in 2009. This RASM
increase related primarily to an increase in yield of 6.7 per cent
for the fourth quarter of 2010, as our quarter-over-quarter load
factor remained relatively consistent. We had significant capacity
increases into the transborder and international markets in the
fourth quarter as compared to the prior year, with domestic
capacity remaining relatively flat. Despite this higher percentage
of lower-yielding ASMs in the longer-haul routes, our yields
improved across our network as compared to the same quarter
of the prior year. Please refer to the table below for details on our
quarter-over-quarter capacity variances.
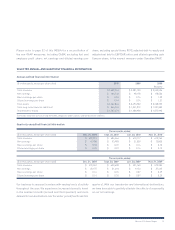
For the fourth quarter of 2010, other revenues, which include
charter, cargo, ancillary, WestJet Vacations non-air and other
revenue, increased by 21.4 per cent to $50.9 million. This increase
was attributable primarily to an increase in WestJet Vacations
non-air revenue. Since the prior year, WestJet Vacations tour
package revenues have increased due to a significant increase
in the number of bookings, as well as from improved average
value per booking.
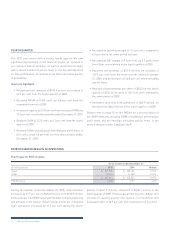
We continued to see improvements in our ancillary fees per
guest, as seen in our fourth quarter ancillary fee per guest
of $6.43, up 23.7 per cent from $5.20 per guest in the same
quarter of the prior year. During the fourth quarter of 2010, we
redesigned our corporate website, www.westjet.com, and, as a
result of amending the booking flow to make the pre-reserved
seating option more prominent, we have seen increases in these
ancillary fees from the same period of last year. Our reservation
system implementation during the fourth quarter of 2009 also
resulted in a period whereby certain fees were being temporarily
waived to accommodate our guests during the adjustment to the
new system.
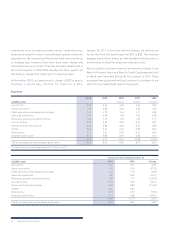
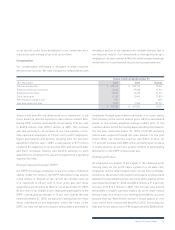
Three months ended December 31
(in millions) 2010 2009 Change
ASMs % of total ASMs % of total ASMs
Domestic 2,834.2 56.4% 2,850.2 64.6% (0.6%)
Charter and scheduled transborder
and international 2,186.8 43.6% 1,562.4 35.4% 40.0%
Total 5,021.0 100.0% 4,412.6 100.0% 13.8%
Fourth quarter 2010 expenses
Three months ended December 31
CASM (cents) 2010 2009 Change
Aircraft fuel 3.57 3.37 5.9%
Airport operations 2.00 2.08 (3.8%)
Flight operations and navigational charges 1.60 1.66 (3.6%)
Sales and distribution 1.33 1.14 16.7%
Marketing, general and administration 1.04 1.24 (16.1%)
Aircraft leasing 0.73 0.57 28.1%
Depreciation and amortization 0.65 0.83 (21.7%)
Infl ight 0.64 0.61 4.9%
Maintenance 0.52 0.54 (3.7%)
Employee profi t share 0.15 0.06 150.0%
12.23 12.10 1.1%
CASM, excluding fuel and employee profi t share 8.51 8.67 (1.8%)