Westjet 2010 Annual Report Download - page 26
Download and view the complete annual report
Please find page 26 of the 2010 Westjet annual report below. You can navigate through the pages in the report by either clicking on the pages listed below, or by using the keyword search tool below to find specific information within the annual report.-
 1
1 -
2
-
3
-
4
-
5
-
6
-
7
-
8
-
9
-
10
-
11
-
12
-
13
-
14
-
15
-
 16
16 -
 17
17 -
 18
18 -
 19
19 -
 20
20 -
 21
21 -
 22
22 -
 23
23 -
 24
24 -
 25
25 -
 26
26 -
 27
27 -
 28
28 -
 29
29 -
 30
30 -
 31
31 -
 32
32 -
 33
33 -
 34
34 -
 35
35 -
 36
36 -
37
-
38
-
39
-
40
-
41
-
42
-
43
-
44
-
45
-
46
-
47
-
48
-
49
-
50
-
51
-
52
-
53
-
54
-
55
-
56
-
57
-
58
-
59
-
60
-
61
-
62
-
63
-
64
-
65
-
66
-
67
-
68
-
69
-
70
-
71
-
72
-
73
-
74
-
75
-
76
-
77
-
78
-
79
-
80
-
81
-
82
-
83
-
84
-
85
-
86
-
87
-
88
-
89
-
90
-
91
-
92
-
93
-
94
-
95
-
96
-
97
-
98
 |
 |

24 WestJet 2010 Annual Report
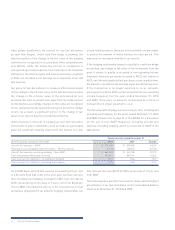
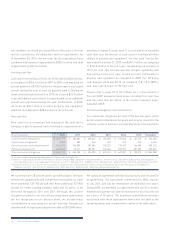
agents and, as such, a higher proportion of our sales are sourced
through this indirect channel. The increase in incentive payments
during the year is directly related to the improvement in the
economy and in our revenues. Incentive payments are structured
so that certain revenue targets must be achieved by the agents
and, with the economic recession in 2009, targets were rarely
achieved in the prior year. The growth of WestJet Vacations from
the prior year has contributed to a significant year-over-year
increase in WVI sales and distribution expenses; however, we
are realizing margin improvements from the prior year. The
increase in distribution expense relates to costs associated with
our new reservation system, such as system transaction fees, as
well as higher GDS fees from the increased use of indirect sales
channels.
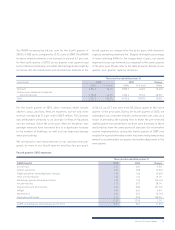
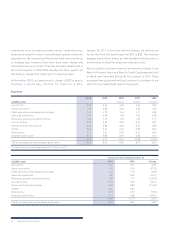
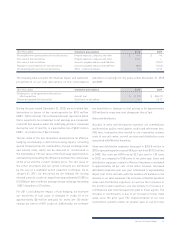
Marketing, general and administration
Marketing largely consists of expenses such as advertising and
promotions and live satellite television licensing fees. General and
administration costs consist of our corporate office departments,
professional fees and insurance costs.
Marketing, general and administration expenses decreased from
the prior year by $13.1 million, from $208.3 million in 2009 to
$195.2 million in 2010, representing a decrease of 6.3 per cent.
On an ASM basis, our marketing, general and administration
expenses decreased by 16.0 per cent, to 1.00 cent in 2010.
Marketing expenses decreased from the prior year primarily
due to a reclassification of our onboard product costs to airport
operations. We also incurred lower information technology (IT)
costs from the prior year due to lower IT consulting and software
costs. In 2009, we had significant IT consulting expenses related
to the implementation of our new reservation system. Software
support costs were also reduced due to the reservation system
implementation, as our new system is outsourced to a third
party and, therefore, our internal IT support costs are reduced.
The reservation system transaction fees are now recorded under
the sales and distribution expense line item. These decreases
were offset by an increase in general and administrative expenses
due to increased compensation expense related to the change
in our CEO during the year, as well as higher general and
administrative consulting costs year over year.
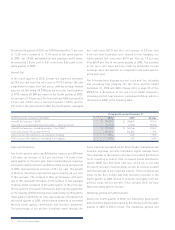
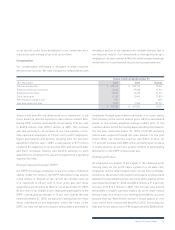
Aircraft leasing
Our most significant infrastructure cost is our aircraft. To support
our growth initiatives, we investigate various alternatives for
financing, with the intention of achieving optimal balance sheet
flexibility while realizing the benefits of low-cost financing.
Leasing is often an attractive alternative to debt-financed aircraft
for reasons such as alleviation of obsolescence risk and the
significantly reduced up-front cash outlay required for deposits
on purchased aircraft. During the year ended December 31, 2010,
we assumed delivery of two leased 737-700 aircraft and three
leased 737-800 aircraft. As at December 31, 2010, we had a total
of 38 leased aircraft. This represents approximately 42 per cent
of our total fleet. At the end of 2009, we had a total of 33 aircraft
under operating leases, representing approximately 38 per cent
of our total registered fleet.
Our aircraft leasing costs per ASM increased by 23.7 per cent in
2010 to 0.73 cents, from 0.59 cents in 2009. The variance was due
to incremental leasing costs on the five leased aircraft delivered
since the end of 2009, as well as a full period of aircraft leasing
costs for the 10 leased aircraft delivered during 2009. This was
partially offset by a stronger Canadian dollar versus the US dollar
compared to the prior year. We have an active foreign exchange
hedging program to offset our US-dollar-denominated aircraft
lease payments on a portion of our leased aircraft. Please refer
to Results of operations – Foreign exchange on page 26 of this
MD&A for further information.
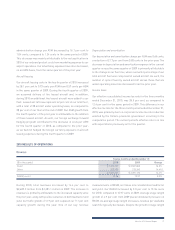
Depreciation and amortization
During the year ended December 31, 2010, depreciation and
amortization expense decreased by $8.4 million or 6.0 per cent
to $132.9 million. On an ASM basis, the depreciation and
amortization charge was 0.68 cents, as compared to 0.80 cents
in the prior year. The decrease in depreciation and amortization
expense per ASM from the prior year is attributable to the fact
that our ASM growth during 2010 has been a result of incremental
leased aircraft in our fleet, rather than owned aircraft. As at
December 31, 2010, our percentage of owned aircraft to aircraft
under operating lease was 58 per cent, a decrease from 62 per cent
as at the end of 2009. As this percentage decreases, the number