Westjet 2010 Annual Report Download - page 88
Download and view the complete annual report
Please find page 88 of the 2010 Westjet annual report below. You can navigate through the pages in the report by either clicking on the pages listed below, or by using the keyword search tool below to find specific information within the annual report.-
 1
1 -
2
-
3
-
4
-
5
-
6
-
7
-
8
-
9
-
10
-
11
-
12
-
13
-
14
-
15
-
16
-
17
-
18
-
19
-
20
-
21
-
22
-
23
-
24
-
25
-
26
-
27
-
28
-
29
-
30
-
31
-
32
-
33
-
34
-
35
-
36
-
37
-
38
-
39
-
40
-
41
-
42
-
43
-
44
-
45
-
46
-
47
-
48
-
49
-
50
-
51
-
52
-
53
-
54
-
55
-
56
-
57
-
58
-
59
-
60
-
61
-
62
-
63
-
64
-
65
-
66
-
67
-
68
-
69
-
70
-
71
-
72
-
73
-
74
-
75
-
76
-
77
-
 78
78 -
 79
79 -
 80
80 -
 81
81 -
 82
82 -
 83
83 -
 84
84 -
 85
85 -
 86
86 -
 87
87 -
 88
88 -
 89
89 -
 90
90 -
 91
91 -
 92
92 -
 93
93 -
 94
94 -
 95
95 -
 96
96 -
 97
97 -
 98
98
 |
 |

86 WestJet 2010 Annual Report
NOTES TO CONSOLIDATED
FINANCIAL STATEMENTS
For the years ended December 31, 2010 and 2009
(Stated in thousands of Canadian dollars,
except share and per share amounts)
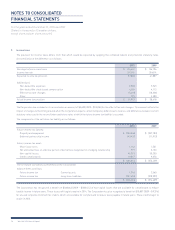
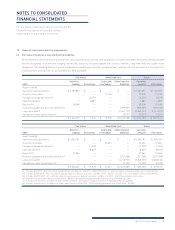
13. Financial instruments and risk management (continued)
(a) Fair value of fi nancial assets and fi nancial liabilities (continued)
Section 3862, Financial Instruments – Disclosures, requires an explanation about how fair value is determined for assets and liabilities measured
in the fi nancial statements at fair value and establishes a hierarchy for which these assets and liabilities must be grouped, based on signifi cant
levels of input, as follows:
Level 1: observable inputs, such as quoted prices in active markets;
Level 2: inputs, other than the quoted market prices in active markets, which are observable, either directly and/or indirectly; and
Level 3: unobservable inputs for the asset or liability in which little or no market data exists, therefore, requiring an entity to develop its
own assumptions.
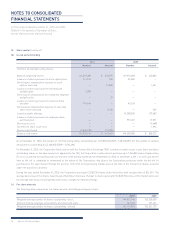
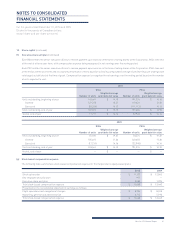
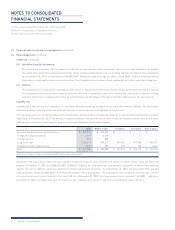
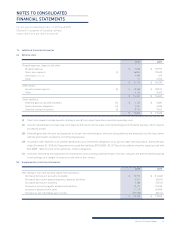
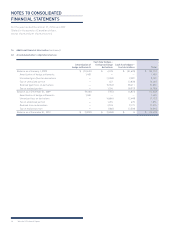
The following items, shown in the consolidated balance sheet as at December 31, 2010 and 2009, are measured at fair value on a recurring basis
using level 1 or level 2 inputs. The fair value of the fi nancial assets and liabilities at December 31, 2010, using level 3 inputs, was $nil (2009 − $nil).
2010 Level 1 Level 2 Total
Asset (liability):
Cash and cash equivalents $ 1,187,899 $ — $ 1,187,899
Foreign exchange derivatives — (3,579) (3,579)
Fuel derivatives — 4,889 4,889
Deposits 28,258 — 28,258
$ 1,216,157 $ 1,310 $ 1,217,467
2009 Level 1 Level 2 Total
Asset (liability):
Cash and cash equivalents $ 1,005,181 $ — $ 1,005,181
Foreign exchange derivatives — (1,249) (1,249)
Fuel derivatives — (8,667) (8,667)
Deposits 27,264 — 27,264
$ 1,032,445 $ (9,916) $ 1,022,529
During the years ended December 31, 2010 and 2009, there were no transfers between level 1, level 2 and level 3 classifi ed assets and liabilities.
Cash and cash equivalents: Cash and cash equivalents, classifi ed as level 1 instruments, consist of bank balances and short-term investments,
primarily highly liquid debt instruments, with terms of up to one year with the majority having terms of less than 91 days. The fair value of cash
and cash equivalents approximates their carrying values because of their short-term nature.
Accounts receivable and accounts payable and accrued liabilities: The carrying amount of accounts receivable and accounts payable and
accrued liabilities approximates their fair values because of the short-term nature of the instruments.
Foreign exchange derivatives: Foreign exchange derivatives consist of forward and option contracts. The fair value of the foreign exchange
forward contracts is measured based on the difference between the contracted rate and the current forward price obtained from the counterparty,
which can be observed and corroborated in the marketplace. These instruments are classifi ed as level 2. As at December 31, 2010, the average
contracted rate on the forward contracts was 1.0264 (2009 – 1.0671) Canadian dollars to US dollars, and the average forward rate used in
determining the fair value was 0.9995 (2009 – 1.0512) Canadian dollars to US dollars. The fair value of the foreign exchange option contracts is
determined through a standard option valuation technique used by the counterparty based on market inputs, including foreign exchange rates,
interest rates and volatilities. These instruments are classifi ed as level 2. There were no foreign exchange option contracts outstanding as
at December 31, 2010.