Westjet 2010 Annual Report Download - page 18
Download and view the complete annual report
Please find page 18 of the 2010 Westjet annual report below. You can navigate through the pages in the report by either clicking on the pages listed below, or by using the keyword search tool below to find specific information within the annual report.-
 1
1 -
2
-
3
-
4
-
5
-
6
-
7
-
 8
8 -
 9
9 -
 10
10 -
 11
11 -
 12
12 -
 13
13 -
 14
14 -
 15
15 -
 16
16 -
 17
17 -
 18
18 -
 19
19 -
 20
20 -
 21
21 -
 22
22 -
 23
23 -
 24
24 -
 25
25 -
 26
26 -
 27
27 -
 28
28 -
29
-
30
-
31
-
32
-
33
-
34
-
35
-
36
-
37
-
38
-
39
-
40
-
41
-
42
-
43
-
44
-
45
-
46
-
47
-
48
-
49
-
50
-
51
-
52
-
53
-
54
-
55
-
56
-
57
-
58
-
59
-
60
-
61
-
62
-
63
-
64
-
65
-
66
-
67
-
68
-
69
-
70
-
71
-
72
-
73
-
74
-
75
-
76
-
77
-
78
-
79
-
80
-
81
-
82
-
83
-
84
-
85
-
86
-
87
-
88
-
89
-
90
-
91
-
92
-
93
-
94
-
95
-
96
-
97
-
98
 |
 |

16 WestJet 2010 Annual Report
For the fourth quarter of 2010, our CASM increased by 1.1 per cent
to 12.23 cents compared to 12.10 cents in the same quarter
of 2009. Our CASM, excluding fuel and employee profit share,
decreased by 1.8 per cent to 8.51 cents from 8.67 cents in the
same quarter of 2009.
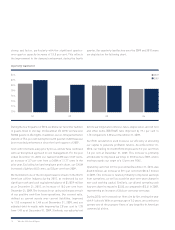
Aircraft fuel
In the fourth quarter of 2010, aircraft fuel expenses increased
by 20.4 per cent from the prior year to $179.3 million. We saw
a significant increase in jet fuel prices, with the average market
price for jet fuel being US $100 per barrel in the fourth quarter
of 2010, versus US $84 per barrel in the fourth quarter of 2009,
an increase of 19.0 per cent. Our fuel costs per ASM increased by
5.9 per cent to 3.57 cents in the fourth quarter of 2010, up from
3.37 cents in the same period in 2009. Our fourth quarter unhedged
fuel costs were $0.73 per litre, an increase of 9.0 per cent
from last year. Including costs related to fuel hedging, our
fourth quarter fuel costs were $0.74 per litre, up 7.2 per cent
from $0.69 per litre in the same quarter of 2009. The increase
in our fuel costs were partially offset by favourable foreign
exchange rates this quarter, as compared to the same quarter
in the prior year.
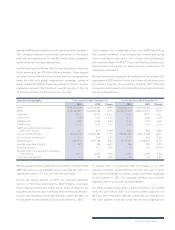
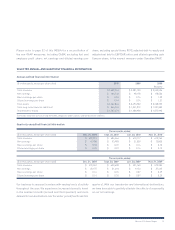
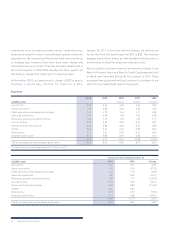
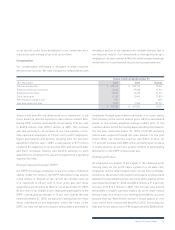
The following table displays our fuel costs per litre, including
and excluding fuel hedging, for the three months ended
December 31, 2010 and 2009. Please refer to page 52 of this
MD&A for a discussion of the use of non-GAAP measures,
including aircraft fuel expense, excluding hedging, which is
reconciled to GAAP in the following table.
Three months ended December 31
($ in thousands, except per litre data) 2010 2009 Change
Aircraft fuel expense – GAAP $ 179,276 $ 148,853 20.4%
Realized loss on designated fuel derivatives – effective portion (1,512) (3,707) (59.2%)
Aircraft fuel expense, excluding hedging – Non-GAAP $ 177,764 $ 145,146 22.5%
Fuel consumption (thousands of litres) 242,621 216,872 11.9%
Fuel costs per litre (dollars) – including fuel hedging 0.74 0.69 7.2%
Fuel costs per litre (dollars) – excluding fuel hedging 0.73 0.67 9.0%
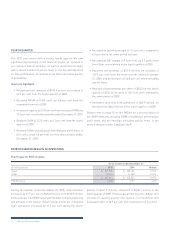
Sales and distribution
Our fourth quarter sales and distribution expense per ASM was
1.33 cents, an increase of 16.7 per cent from 1.14 cents in the
same quarter of the prior year. Sales and distribution expenses
increased to $67.0 million from $50.4 million in the same period
of 2009, representing an increase of 33.1 per cent. The growth
of WestJet Vacations represented approximately 40 per cent
of this increase. The increase in WestJet Vacations costs were
due to the significant increases in the number of tour package
bookings made compared to the same quarter of the prior year.
This resulted in increased commissions and incentive payments,
as the majority of WVI bookings were made indirectly through the
travel agency community. As well, sales expenses increased from
the fourth quarter of 2009, which related primarily to increased
WestJet travel agency commission and incentive payments.
The percentage of our airline’s bookings made through the
travel trade has increased, which drives higher commission and
incentive expenses, but also contributes higher average fares.
The remainder of the variance was due to increased distribution
costs, resulting primarily from increased global distribution
system (GDS) fees and credit card fees, which are in line with
the rate of increase of our bookings, as well as costs associated
with the redesign of our corporate website. These increases are
offset by the $2.4 million bad debt provision recorded in the
fourth quarter of 2009 related to accounts receivable from our
previous cargo service provider. Since January 2010, we have
had a new cargo partner in place.
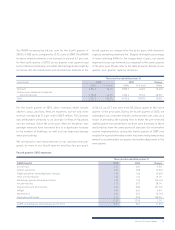
Marketing, general and administration
During the fourth quarter of 2010, our marketing, general and
administration expense decreased by $2.4 million from the same
quarter of 2009 to $52.3 million. The marketing, general and