Westjet 2010 Annual Report Download - page 16
Download and view the complete annual report
Please find page 16 of the 2010 Westjet annual report below. You can navigate through the pages in the report by either clicking on the pages listed below, or by using the keyword search tool below to find specific information within the annual report.-
 1
1 -
2
-
3
-
4
-
5
-
 6
6 -
 7
7 -
 8
8 -
 9
9 -
 10
10 -
 11
11 -
 12
12 -
 13
13 -
 14
14 -
 15
15 -
 16
16 -
 17
17 -
 18
18 -
 19
19 -
 20
20 -
 21
21 -
 22
22 -
 23
23 -
 24
24 -
 25
25 -
 26
26 -
27
-
28
-
29
-
30
-
31
-
32
-
33
-
34
-
35
-
36
-
37
-
38
-
39
-
40
-
41
-
42
-
43
-
44
-
45
-
46
-
47
-
48
-
49
-
50
-
51
-
52
-
53
-
54
-
55
-
56
-
57
-
58
-
59
-
60
-
61
-
62
-
63
-
64
-
65
-
66
-
67
-
68
-
69
-
70
-
71
-
72
-
73
-
74
-
75
-
76
-
77
-
78
-
79
-
80
-
81
-
82
-
83
-
84
-
85
-
86
-
87
-
88
-
89
-
90
-
91
-
92
-
93
-
94
-
95
-
96
-
97
-
98
 |
 |

14 WestJet 2010 Annual Report
FOURTH QUARTER
The 2010 year ended with a strong fourth quarter. We saw
significant improvement in our financial results, as reported in
our revenues and net earnings, as well as operational strength
with a record number of guests flown in one day and improved
on-time performance, all resulting in our 23rd consecutive quarter
of profitability.
Quarterly highlights
• Recognized total revenues of $692.8 million, an increase of
21.5 per cent from the fourth quarter of 2009.
• Recorded RASM of 13.80 cents, up 6.8 per cent from the
comparable period of 2009.
• Increased capacity by 13.8 per cent and increased RPMs by
13.9 per cent, over the three months ended December 31, 2009.
• Realized CASM of 12.23 cents, up 1.1 per cent from the fourth
quarter of 2009.
• Realized CASM, excluding fuel and employee profit share, of
8.51 cents, down 1.8 per cent over the three months ended
December 31, 2009.
• Recorded an operating margin of 11.4 per cent, compared to
6.3 per cent in the same period last year.
• Recorded an EBT margin of 9.7 per cent, up 5.7 points from
the 4.0 per cent reported in the fourth quarter of 2009.
• Reported net earnings of $47.9 million, an increase of
137.5 per cent from the three months ended December
31, 2009, and an increase of 216.8 per cent when excluding
special items.
• Realized diluted earnings per share of $0.33 for the fourth
quarter of 2010, an increase of 135.7 per cent compared to
the same period of 2009.
• Generated cash flow from operations of $69.9 million, an
increase from $64.6 million in the fourth quarter of 2009.
Please refer to page 52 of this MD&A for a reconciliation of
non-GAAP measures, including CASM, excluding fuel and employee
profit share, and net earnings, excluding special items, to the
nearest measure under Canadian GAAP.
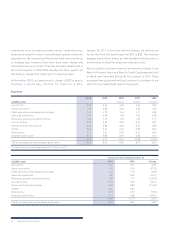
FOURTH QUARTER RESULTS OF OPERATIONS
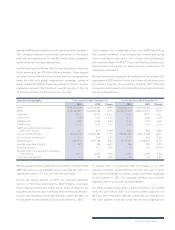
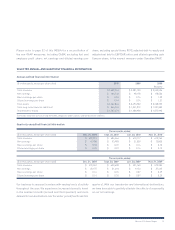
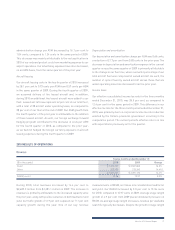
Fourth quarter 2010 revenue
Three months ended December 31
($ in thousands) 2010 2009 Change
Guest $ 641,905 $ 528,104 21.5%
Other 50,910 41,938 21.4%
$ 692,815 $ 570,042 21.5%
RASM (cents) 13.80 12.92 6.8%
During the quarter ended December 31, 2010, total revenues
increased by 21.5 per cent to $692.8 million from $570.0 million
in the same period of 2009, largely attributable to improved pricing
and demand in the market. Guest revenues from our scheduled
flight operations increased by 21.5 per cent during the fourth
quarter to $641.9 million, compared to $528.1 million in the
fourth quarter of 2009. This was due primarily to the 13.8 per cent
increase in capacity quarter over quarter, in conjunction with
increased traffic of 13.9 per cent and improvement in our yield.