Westjet 2010 Annual Report Download - page 32
Download and view the complete annual report
Please find page 32 of the 2010 Westjet annual report below. You can navigate through the pages in the report by either clicking on the pages listed below, or by using the keyword search tool below to find specific information within the annual report.-
 1
1 -
2
-
3
-
4
-
5
-
6
-
7
-
8
-
9
-
10
-
11
-
12
-
13
-
14
-
15
-
16
-
17
-
18
-
19
-
20
-
21
-
 22
22 -
 23
23 -
 24
24 -
 25
25 -
 26
26 -
 27
27 -
 28
28 -
 29
29 -
 30
30 -
 31
31 -
 32
32 -
 33
33 -
 34
34 -
 35
35 -
 36
36 -
 37
37 -
 38
38 -
 39
39 -
 40
40 -
 41
41 -
 42
42 -
43
-
44
-
45
-
46
-
47
-
48
-
49
-
50
-
51
-
52
-
53
-
54
-
55
-
56
-
57
-
58
-
59
-
60
-
61
-
62
-
63
-
64
-
65
-
66
-
67
-
68
-
69
-
70
-
71
-
72
-
73
-
74
-
75
-
76
-
77
-
78
-
79
-
80
-
81
-
82
-
83
-
84
-
85
-
86
-
87
-
88
-
89
-
90
-
91
-
92
-
93
-
94
-
95
-
96
-
97
-
98
 |
 |

30 WestJet 2010 Annual Report
sole member, we would be responsible for the costs of the fuel
facility corporations, including debt service requirements. As
at November 30, 2010, the nine fuel facility corporations have
combined total assets of approximately $345.5 million and debt
of approximately $312.6 million.
Investing cash flow
Cash used in investing activities for 2010 totalled $48.6 million,
as compared to $166.7 million in 2009. In 2009, cash was used for
aircraft additions of $118.7 million for the purchase of one leased
aircraft during the year as well as deposits paid to Boeing on
future owned aircraft deliveries. In 2010, we incurred $29.9 million
in aircraft addition costs related to deposits paid, as no additional
aircraft were purchased during the year. Furthermore, in 2010,
we incurred $18.7 million in other property and equipment
additions as compared to $48.0 million in the prior year.
Free cash flow
Free cash flow is a measure that represents the cash that a
company is able to generate after meeting its requirements to
maintain or expand its asset base. It is a calculation of operating
cash flow, less the amount of cash used in investing activities
related to property and equipment. Our free cash flow for the
year ended December 31, 2010, was $394.7 million, as compared
to $152.0 million in the prior year, representing an increase of
159.7 per cent. This increase was due to higher operating cash
flow relative to the prior year, as well as lower investments in
property and equipment as compared to 2009. Our 2010 free
cash flow per share was $2.72, as compared to $1.15 in 2009, a
year-over-year increase of 136.5 per cent.
Please refer to page 52 of this MD&A for a reconciliation of
the non-GAAP measures listed above, including free cash flow
and free cash flow per share, to the nearest measure under
Canadian GAAP.
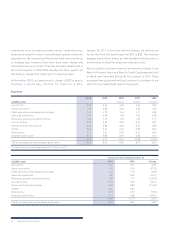
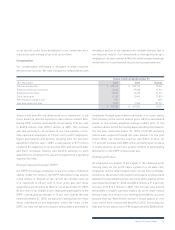
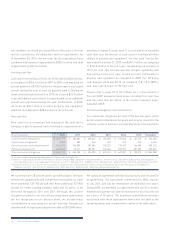
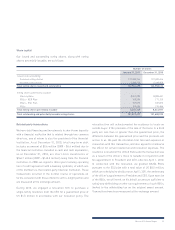
Contractual obligations and commitments
Our contractual obligations for each of the next five years, which
do not include commitments for goods and services required in the
ordinary course of business, are indicated in the following table:
($ in thousands) Total 2011 2012 2013 2014 2015 Thereafter
Long-term debt repayments $ 1,047,177 $ 183,681 $ 169,642 $ 169,358 $ 169,626 $ 132,170 $ 222,700
Capital lease obligations(i) 5,878 282 245 245 245 245 4,616
Operating leases and commitments(ii) 1,366,015 206,983 202,085 195,222 190,423 166,189 405,113
Purchase obligations(iii) 1,647,046 72,217 182,961 270,436 287,597 401,406 432,429
Total contractual obligations $ 4,066,116 $ 463,163 $ 554,933 $ 635,261 $ 647,891 $ 700,010 $ 1,064,858
(i) Includes weighted average imputed interest at 5.28 per cent totalling $2,521.
(ii) Relates to operating leases and commitments for aircraft, land, buildings, equipment, computer hardware, software licences and satellite programming. The obligations of
these operating leases, where applicable, in US dollars are: 2011 – $186,454; 2012 – $188,807; 2013 – $185,535; 2014 – $184,359; 2015 – $161,149; and thereafter $361,979.
(iii) Relates to purchases of aircraft, as well as amounts to be paid for live satellite television systems on purchased and leased aircraft. These purchase obligations in
US dollars are: 2011 – $72,607; 2012 – $183,949; 2013 – $271,896; 2014 – $289,150; 2015 – $403,574; and thereafter $434,764.
We currently have 38 aircraft under operating leases. We have
entered into agreements with independent third parties to lease
three additional 737-700 aircraft and three additional 737-800
aircraft for terms ranging between eight and 10 years, to be
delivered throughout 2011 and 2012. Although the current
obligations related to our aircraft operating lease agreements
are not recognized on our balance sheet, we include these
commitments in assessing our overall leverage through our
adjusted debt-to-equity and adjusted net debt to EBITDAR ratios.
We signed an agreement with Bell ExpressVu to provide satellite
programming. The agreement commenced in 2004, expires
in July
2011
, and can be renewed for an additional four years.
During 2009, we amended our agreement with LiveTV to install,
maintain and operate live satellite television for all of our aircraft
f
or a term of 10 years. The minimum commitment amounts
associated with these agreements have been included in the
operating leases and commitments caption in the table above.