Westjet 2010 Annual Report Download - page 13
Download and view the complete annual report
Please find page 13 of the 2010 Westjet annual report below. You can navigate through the pages in the report by either clicking on the pages listed below, or by using the keyword search tool below to find specific information within the annual report.-
 1
1 -
2
-
 3
3 -
 4
4 -
 5
5 -
 6
6 -
 7
7 -
 8
8 -
 9
9 -
 10
10 -
 11
11 -
 12
12 -
 13
13 -
 14
14 -
 15
15 -
 16
16 -
 17
17 -
 18
18 -
 19
19 -
 20
20 -
 21
21 -
 22
22 -
 23
23 -
24
-
25
-
26
-
27
-
28
-
29
-
30
-
31
-
32
-
33
-
34
-
35
-
36
-
37
-
38
-
39
-
40
-
41
-
42
-
43
-
44
-
45
-
46
-
47
-
48
-
49
-
50
-
51
-
52
-
53
-
54
-
55
-
56
-
57
-
58
-
59
-
60
-
61
-
62
-
63
-
64
-
65
-
66
-
67
-
68
-
69
-
70
-
71
-
72
-
73
-
74
-
75
-
76
-
77
-
78
-
79
-
80
-
81
-
82
-
83
-
84
-
85
-
86
-
87
-
88
-
89
-
90
-
91
-
92
-
93
-
94
-
95
-
96
-
97
-
98
 |
 |

WestJet 2010 Annual Report 11
among all 890 brands studied in overall connection with customers.
This category measured emotional connection to the brand,
practical and aspirational fit with the brand, and a company’s
ability to deliver on brand expectations.
Further, we won the Airline Staff Service Excellence Award for
North America at the 2010 World Airline Awards. These awards
are based on the World Airline Survey, and are recognized for
being the only truly global, independent passenger survey of
airline standards. WestJet was also named in Travel + Leisure
magazine’s annual “World’s Best” awards as one of the top
10 domestic airlines for the second year in a row.
These awards are a testament to our over 8,000 WestJetters
who remain committed to providing a fun, friendly and caring
world-class guest experience. Our receipt of the prestigious
International Make-A-Wish® Corporate Partner Award also
demonstrates our culture of caring and our commitment to
community investment.
We have generously rewarded the dedication of our people with
approximately $200 million of total profit share distributions since
our airline’s inception. Our continued strength, both financially
and operationally, would not be possible without each and every
one of our WestJetters.
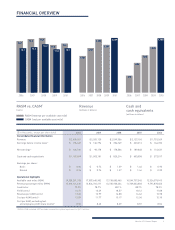
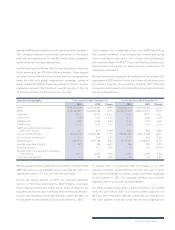
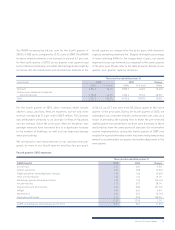
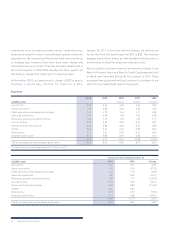
Operational highlights Three months ended December 31 Twelve months ended December 31
2010 2009 Change 2010 2009 Change
ASMs 5,021,010,134 4,412,573,833 13.8% 19,535,291,313 17,587,640,902 11.1%
RPMs 3,941,660,897 3,460,905,058 13.9% 15,613,121,610 13,834,761,211 12.9%
Load factor 78.5% 78.4% 0.1 pts. 79.9% 78.7% 1.2 pts.
Yield (cents) 17.58 16.47 6.7% 16.71 16.49 1.3%
RASM (cents) 13.80 12.92 6.8% 13.36 12.97 3.0%
CASM (cents) 12.23 12.10 1.1% 12.09 11.77 2.7%
CASM, excluding fuel and employee
profi t share (cents) 8.51 8.67 (1.8%) 8.52 8.45 0.8%
Fuel consumption (litres) 242,620,920 216,871,585 11.9% 950,341,292 859,115,698 10.6%
Fuel costs per litre (dollars) 0.74 0.69 7.2% 0.71 0.66 7.6%
Segment guests 3,803,550 3,515,168 8.2% 15,173,581 14,038,827 8.1%
Average stage length (miles) 982 923 6.4% 968 923 4.9%
Utilization (hours) 11.7 11.4 2.6% 11.6 11.7 (0.9%)
Number of full-time equivalent employees
at period end 6,877 6,291 9.3%
6,877
6,291 9.3%
Fleet size at period end 91 86 5.8% 91 86 5.8%
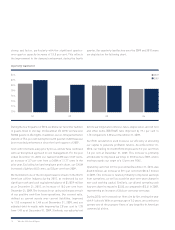
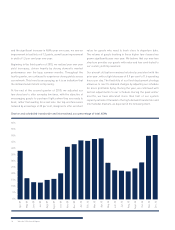
We are pleased with the significant improvement in results from
2009. Our year-over-year RASM increase was 3.0 per cent, on a
capacity increase of 11.1 per cent from the prior year.
During the fourth quarter of 2010, we launched seasonal
service to three new destinations: New Orleans, Louisiana;
Grand Cayman Island; and Santa Clara, Cuba. In addition, we
launched service this year to Kindley Field, Bermuda; Windsor,
Ontario; and Samana, Dominican Republic, which brought our
total number of destinations to 70 as at December 31, 2010.
In January 2011, in conjunction with the release of our 2011
summer schedule, we announced new non-stop service from
Vancouver and Calgary to Orange County, California, beginning
in the summer of 2011. The summer schedule also includes
expanded service across our existing network.
Our 2010 load factor was up by 1.2 points to 79.9 per cent in 2010
from 78.7 per cent in 2009. Our fourth quarter load factor of
78.5 per cent remained relatively consistent, as compared to
the same quarter of the prior year. We are encouraged by our