Westjet 2010 Annual Report Download - page 29
Download and view the complete annual report
Please find page 29 of the 2010 Westjet annual report below. You can navigate through the pages in the report by either clicking on the pages listed below, or by using the keyword search tool below to find specific information within the annual report.-
 1
1 -
2
-
3
-
4
-
5
-
6
-
7
-
8
-
9
-
10
-
11
-
12
-
13
-
14
-
15
-
16
-
17
-
18
-
 19
19 -
 20
20 -
 21
21 -
 22
22 -
 23
23 -
 24
24 -
 25
25 -
 26
26 -
 27
27 -
 28
28 -
 29
29 -
 30
30 -
 31
31 -
 32
32 -
 33
33 -
 34
34 -
 35
35 -
 36
36 -
 37
37 -
 38
38 -
 39
39 -
40
-
41
-
42
-
43
-
44
-
45
-
46
-
47
-
48
-
49
-
50
-
51
-
52
-
53
-
54
-
55
-
56
-
57
-
58
-
59
-
60
-
61
-
62
-
63
-
64
-
65
-
66
-
67
-
68
-
69
-
70
-
71
-
72
-
73
-
74
-
75
-
76
-
77
-
78
-
79
-
80
-
81
-
82
-
83
-
84
-
85
-
86
-
87
-
88
-
89
-
90
-
91
-
92
-
93
-
94
-
95
-
96
-
97
-
98
 |
 |

WestJet 2010 Annual Report 27
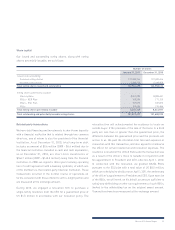
(2009 – US $19.9 million). These net monetary assets consist
mainly of US-dollar cash and cash equivalents and security
deposits on various leased and financed aircraft, US-dollar
accounts payable and accrued liabilities, and our US-dollar
long-term debt facility signed in the fourth quarter of 2009. We
hold US-dollar-denominated cash and short-term investments
to reduce the foreign currency risk inherent in our US-dollar
expenditures. We reported a foreign exchange loss of $0.8 million
in 2010, as compared to a foreign exchange loss of $12.3 million
in 2009, on the revaluation of our US-dollar-denominated net
monetary assets.
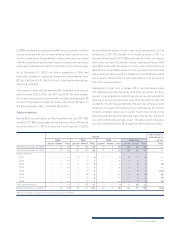
We periodically use financial derivatives to manage our exposure
to foreign exchange risk. As at December 31, 2010, we entered into
foreign exchange forward contracts for an average US $11.5 million
per month for the period of January to December 2011. These
contracts totalled US $138.4 million at a weighted average
contract rate of 1.0264 per US dollar to offset a portion of our
US-dollar-denominated aircraft lease payments. Upon proper
qualification, we designated the forward contracts as effective
cash flow hedges for accounting purposes. Under cash flow
hedge accounting, the effective portion of the change in the fair
value of the hedging instrument is recognized in AOCL, while
the ineffective portion is recognized in non-operating income
(expense). Upon maturity of the derivative instrument, the effective
gains and losses previously recognized in AOCL are recorded
in net earnings as a component of aircraft leasing expense. As
at December 31, 2010, no portion of the forward contracts was
considered ineffective.
As at December 31, 2010, the fair value of the foreign exchange
forward contracts was $3.6 million (2009 – $1.2 million),
included in accounts payable and accrued liabilities and $nil
(2009 – $0.2 million) recorded in prepaid expenses, deposits and
other. For the year ended December 31, 2010, we realized a loss
before tax on the forward contracts of $2.1 million (2009 – gain
of $5.6 million), included in net earnings as an increase
(2009 – decrease) to aircraft leasing expense. The estimated
amount reported in AOCL that is expected to be reclassified to net
earnings as a component of aircraft leasing expense in the next
12 months is a loss before tax of $3.6 million (2009 – $1.0 million).
The fair value of the foreign exchange forward contracts is
measured based on the difference between the contracted rate
and the current forward price obtained from the counterparty,
which can be observed and corroborated in the marketplace.
Income taxes
Our operations span several Canadian tax jurisdictions, subjecting
our income to various rates of taxation. As such, the computation
of the provision for income taxes involves judgments based on the
analysis of several different pieces of legislation and regulation.
Our effective consolidated income tax rate for 2010 was
30.5 per cent, as compared to 28.2 per cent in 2009. The variance
was driven primarily by corporate income tax rate reductions
enacted by various provincial governments in 2009, offset
by unfavourable revisions to the measurement of previously
recognized future tax assets also in the comparative period.
Although our year-to-date effective rate fell within our expected
range of 29 to 31 per cent at the beginning of the year, revisions
to the measurement of future income tax assets and liabilities,
revised expectations of when certain temporary differences are
anticipated to reverse, and the acceleration of non-deductible
stock-based compensation expense due to the departure of the
former CEO resulted in a net $2.0 million unfavourable increase
to future income tax expense. Excluding these items, our effective
rate would have been reduced to 29.5 per cent, which is still
within our expected range. For 2011, our expected effective tax
rate should remain within the range of 29 to 31 per cent.
Guest experience
At WestJet, we are focused on meeting the needs of our guests
while maintaining the highest safety standards. We are committed
to delivering a positive guest experience at every stage of our
service, from the time the flight is booked to its completion.
Key performance indicators
On-time performance and completion rates are calculated
based on the U.S. Department of Transportation’s standards of
measurement for the North American airline industry. Our bag
ratio represents the number of delayed or lost baggage claims
made per 1,000 guests.