Westjet 2010 Annual Report Download - page 54
Download and view the complete annual report
Please find page 54 of the 2010 Westjet annual report below. You can navigate through the pages in the report by either clicking on the pages listed below, or by using the keyword search tool below to find specific information within the annual report.-
 1
1 -
2
-
3
-
4
-
5
-
6
-
7
-
8
-
9
-
10
-
11
-
12
-
13
-
14
-
15
-
16
-
17
-
18
-
19
-
20
-
21
-
22
-
23
-
24
-
25
-
26
-
27
-
28
-
29
-
30
-
31
-
32
-
33
-
34
-
35
-
36
-
37
-
38
-
39
-
40
-
41
-
42
-
43
-
 44
44 -
 45
45 -
 46
46 -
 47
47 -
 48
48 -
 49
49 -
 50
50 -
 51
51 -
 52
52 -
 53
53 -
 54
54 -
 55
55 -
 56
56 -
 57
57 -
 58
58 -
 59
59 -
 60
60 -
 61
61 -
 62
62 -
 63
63 -
 64
64 -
65
-
66
-
67
-
68
-
69
-
70
-
71
-
72
-
73
-
74
-
75
-
76
-
77
-
78
-
79
-
80
-
81
-
82
-
83
-
84
-
85
-
86
-
87
-
88
-
89
-
90
-
91
-
92
-
93
-
94
-
95
-
96
-
97
-
98
 |
 |

52 WestJet 2010 Annual Report
the first quarter of 2010. As at December 31, 2010, we have
hedged approximately 20 per cent of our anticipated jet fuel
requirements for the next 12 months.
For the first quarter of 2011, we anticipate that CASM, excluding
fuel and profit share, will be flat to down year-over-year on
an IFRS-comparable basis. From our inception, maintaining a
low-cost structure has been one of the keys to success at WestJet
and is ingrained in the way we do business. Throughout 2011,
we will roll out more self-tagging baggage functionality at nine
additional domestic airports and also exploit some cost-saving
opportunities we have identified in the procurement process.
We expect year-over-year capacity to increase between 9 and
10 per cent for the first quarter of 2011, and full-year capacity
to increase between 6 and 8 percent as compared to 2010. We
will take delivery of three aircraft during the first three months
of 2011 and three more throughout the remainder of the year,
ending 2011 with a fleet of 97. The additional capacity in the first
quarter will continue to be directed into the transborder and
international markets with domestic capacity slightly down.
Our full-year domestic capacity is expected to grow modestly
(1 to 2 per cent) in 2011, with increased frequencies within the
eastern triangle, which includes Toronto, Montreal and Ottawa,
and core transcontinental routes, including Vancouver-Toronto
and Calgary-Toronto. We have also introduced year-round
service on the Ottawa-Halifax and Ottawa-Vancouver routes.
These capacity extensions align with our code-share and business
traveller strategies.
For 2011, we anticipate total capital expenditures of $95 to
$105 million, with the majority of the spending related to aircraft
deposits and rotables. We purchased an aircraft in the first
quarter of 2011, which is the key reason for the increase in capital
expenditures, when compared to 2010 when we added only
leased aircraft.
As we move forward into 2011, we are encouraged by the
strengthening yield trend that emerged in the second half of 2010
and the growing optimism surrounding an economic recovery.
We expect that first quarter year-over-year RASM improvements
will be roughly in line with the positive change seen in the fourth
quarter of 2010. We realize fuel costs may be a headwind in 2011,
but we firmly believe that our fundamental low-cost structure
and strong balance sheet positions us well to weather fuel price
uncertainty. We will continue to capitalize on the recent investment
in our new reservations systems. Momentum is building and
our WestJet brand is stronger than ever. For 2011, we are
confident in our ability to continue to achieve profitable growth,
driven by the commitment of each and every one of our over
8,000 WestJetters.
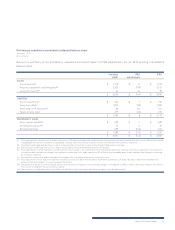
NON-GAAP MEASURES
To supplement our consolidated financial statements presented
in accordance with Canadian GAAP, we use various non-GAAP
performance measures as discussed below. These measures
are provided to enhance the reader’s overall understanding of
our current financial performance; they are included to provide
investors and management with an alternative method for
assessing our operating results in a manner that is focused
on the performance of our ongoing operations and to provide a
more consistent basis for comparison between quarters. These
measures are not in accordance with, or an alternative to, Canadian
GAAP and do not have standardized meanings. Therefore, they
are not likely to be comparable to similar measures presented
by other entities.
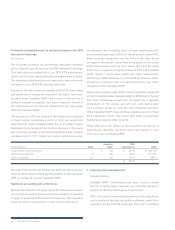
The following non-GAAP measures are used to monitor our
financial performance:
Adjusted debt: The sum of long-term debt, obligations under
capital leases and off-balance-sheet aircraft operating leases.
Our practice, consistent with common industry practice, is to
multiply the trailing 12 months of aircraft leasing expense by 7.5
to derive a present value debt equivalent. This measure is used
in the calculation of adjusted debt-to-equity and adjusted net
debt to EBITDAR, as defined below.
Adjusted equity: The sum of share capital, contributed surplus
and retained earnings, excluding AOCL. This measure is used in
the calculation of adjusted debt-to-equity.