Westjet 2010 Annual Report Download - page 21
Download and view the complete annual report
Please find page 21 of the 2010 Westjet annual report below. You can navigate through the pages in the report by either clicking on the pages listed below, or by using the keyword search tool below to find specific information within the annual report.-
 1
1 -
2
-
3
-
4
-
5
-
6
-
7
-
8
-
9
-
10
-
 11
11 -
 12
12 -
 13
13 -
 14
14 -
 15
15 -
 16
16 -
 17
17 -
 18
18 -
 19
19 -
 20
20 -
 21
21 -
 22
22 -
 23
23 -
 24
24 -
 25
25 -
 26
26 -
 27
27 -
 28
28 -
 29
29 -
 30
30 -
 31
31 -
32
-
33
-
34
-
35
-
36
-
37
-
38
-
39
-
40
-
41
-
42
-
43
-
44
-
45
-
46
-
47
-
48
-
49
-
50
-
51
-
52
-
53
-
54
-
55
-
56
-
57
-
58
-
59
-
60
-
61
-
62
-
63
-
64
-
65
-
66
-
67
-
68
-
69
-
70
-
71
-
72
-
73
-
74
-
75
-
76
-
77
-
78
-
79
-
80
-
81
-
82
-
83
-
84
-
85
-
86
-
87
-
88
-
89
-
90
-
91
-
92
-
93
-
94
-
95
-
96
-
97
-
98
 |
 |

WestJet 2010 Annual Report 19
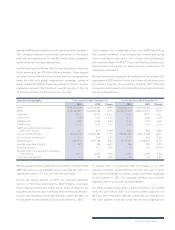
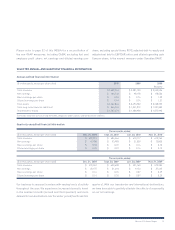
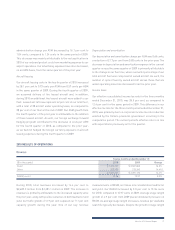
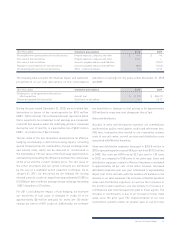
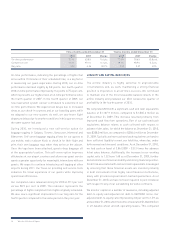
Twelve months ended December 31
(in millions) 2010 2009 Change
ASMs % of total ASMs % of total ASMs
Domestic 12,415.0 63.6% 12,506.9 71.1% (0.7%)
Charter and scheduled transborder and international 7,120.3 36.4% 5,080.7 28.9% 40.1%
Total 19,535.3 100.0% 17,587.6 100.0% 11.1%
On average, long-haul routes have lower yields; however, even
with the substantial capacity increase in the transborder and
international markets, we experienced overall yield improvement.
This is due to stronger yields and slightly higher load factors in the
domestic market, as compared to the prior year, on a relatively
consistent level of capacity in the domestic market. Our guest
t
raffic remained relatively consistent year over year in our
domestic market, with strong increases in our transborder and
international markets consistent with our ASM growth in those
markets. Our capacity in the transborder and international
markets increased by 40.1 per cent from 2009, with a consistent
load factor and a flat year-over-year yield.
As announced in late 2010, we will be operating a leased
Boeing 757-200 from North American Airlines to provide non-stop
services between Calgary and Honolulu, Calgary and Maui, and
Edmonton and Maui between February 12 and April 30, 2011. This
temporary lease agreement will allow us to provide additional
capacity for non-stop service from Alberta to Hawaii. We will have
a WestJet service ambassador onboard each 757-200 flight to
ensure that the WestJet guest experience is consistently delivered
to our standards and expectations. This initiative once again
demonstrates our WestJet spirit and our ability to meet the
service needs of our guests.
For 2010, other revenues decreased by 4.4 per cent to $204.0 million
from $213.3 million in 2009. We saw significant increases in
WestJet Vacations non-air revenue, offset by decreases in our
charter revenues due to the termination of our charter agreement
with Transat, effective May 10, 2009. Despite the absence of this
agreement in 2010, our strong load factor and traffic growth
indicate that our increased capacity is being profitably absorbed
by the market.
WestJet Vacations experienced significant revenue growth in
2010. Vacation package revenue increased over 70 per cent
from the prior year. Growth was largely to our Southern winter
destinations in Mexico and the Caribbean, in line with WestJet’s
network expansion into these regions. This growth, along with
longer stays in these markets, provided significant year-over-
year growth in our other revenues. WestJet Vacations continues
to be successful in generating an additional revenue stream and
supporting our network expansion to vacation destinations.
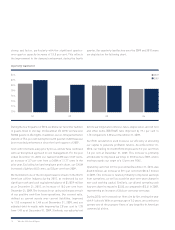
Ancillary revenues, which include service fees, onboard sales,
and partner and program revenue, provide an opportunity to
maximize our profits through the sale of higher-margin goods
and services, while enhancing our overall guest experience by
providing guests with additional products and services to meet
their needs. For 2010, ancillary revenues were $91.1 million,
representing a slight decrease from $91.7 million in 2009.
Ancillary fees per guest for the year decreased by 9.5 per cent to
$6.03 per guest from $6.66 per guest in 2009.
After the October 2009 implementation of our Sabre reservation
system, we experienced lower pre-reserved seating, change and
cancellation fees. The variance in pre-reserved seating fees
was experienced throughout the first three quarters of 2010, as
compared to 2009, mainly due to the shift in distribution methods to
more indirect channels, such as the use of travel agents. With our
new reservation system, we had limited ability to sell pre-reserved
seating through these channels. We have implemented plans
to increase the availability of pre-reserved seating through all
booking channels, and have seen these fees per guest continue
to improve throughout 2010. In addition, during the fourth quarter
of 2010, our corporate website redesign helped to improve
our conversion rates on pre-reserved seating fees, as the
booking flow now highlights this option more prominently than
in the past. We are now realizing levels of pre-reserved seating
fees per guest that are higher than those experienced prior to
our reservation system implementation. Lastly, for a period