Westjet 2010 Annual Report Download - page 14
Download and view the complete annual report
Please find page 14 of the 2010 Westjet annual report below. You can navigate through the pages in the report by either clicking on the pages listed below, or by using the keyword search tool below to find specific information within the annual report.-
 1
1 -
2
-
3
-
 4
4 -
 5
5 -
 6
6 -
 7
7 -
 8
8 -
 9
9 -
 10
10 -
 11
11 -
 12
12 -
 13
13 -
 14
14 -
 15
15 -
 16
16 -
 17
17 -
 18
18 -
 19
19 -
 20
20 -
 21
21 -
 22
22 -
 23
23 -
 24
24 -
25
-
26
-
27
-
28
-
29
-
30
-
31
-
32
-
33
-
34
-
35
-
36
-
37
-
38
-
39
-
40
-
41
-
42
-
43
-
44
-
45
-
46
-
47
-
48
-
49
-
50
-
51
-
52
-
53
-
54
-
55
-
56
-
57
-
58
-
59
-
60
-
61
-
62
-
63
-
64
-
65
-
66
-
67
-
68
-
69
-
70
-
71
-
72
-
73
-
74
-
75
-
76
-
77
-
78
-
79
-
80
-
81
-
82
-
83
-
84
-
85
-
86
-
87
-
88
-
89
-
90
-
91
-
92
-
93
-
94
-
95
-
96
-
97
-
98
 |
 |
12 WestJet 2010 Annual Report
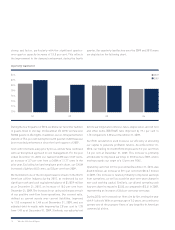
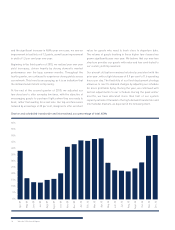
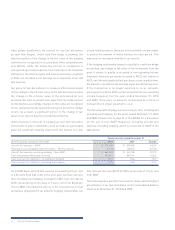
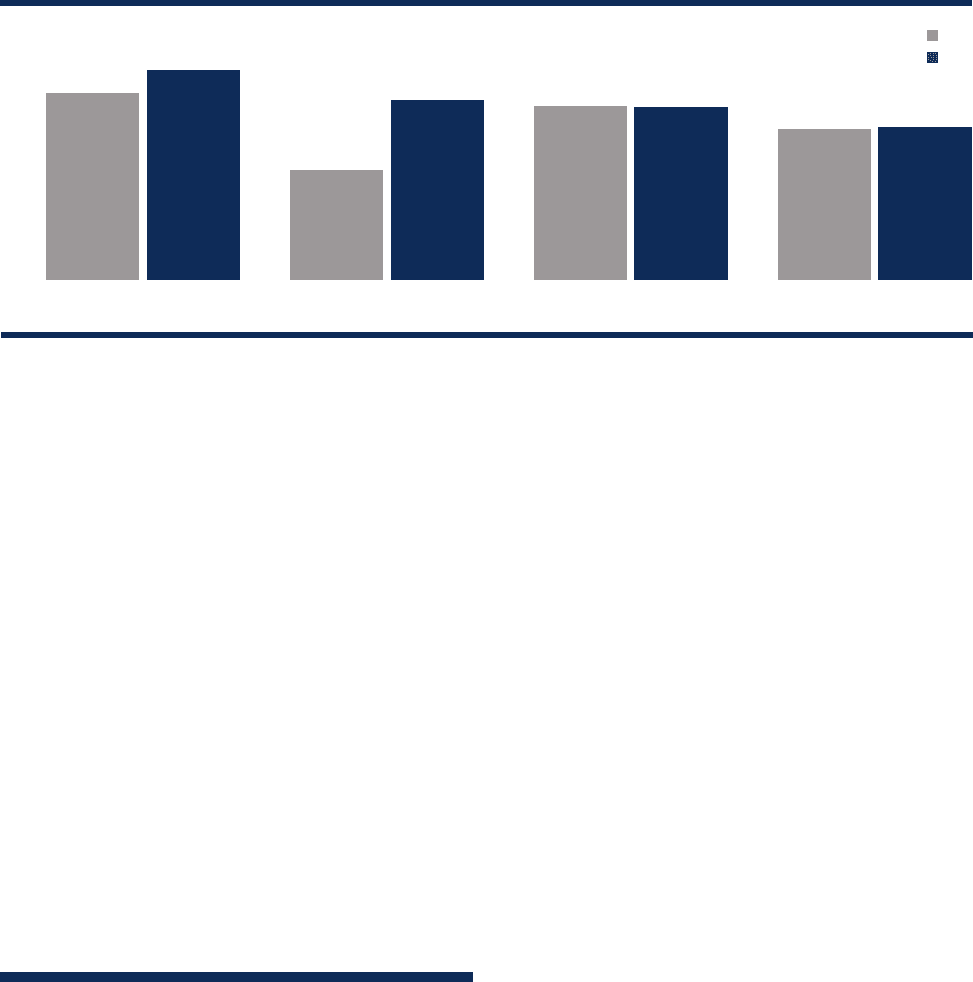
strong oad factor, particularly with the significant quarter-
over-quarter capacity increase of 13.8 per cent. This reflects
the improvement in the demand environment during the fourth
quarter. Our quarterly load factors over the 2009 and 2010 years
are depicted on the following chart.
During the fourth quarter of 2010, we broke our record for number
of guests flown in one day. On December 23, 2010, we flew over
50,000 guests on 434 flights. In addition, our on-time performance
statistic of 75.4 per cent during the fourth quarter of 2010 was our
best recorded performance since the fourth quarter of 2007.
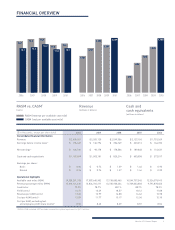
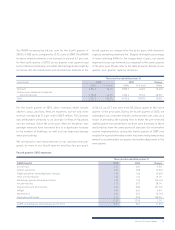
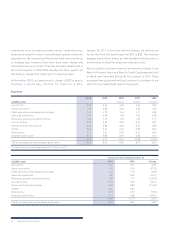
Cost control remains a key priority for us, and we have continued
with our disciplined approach to cost management. For the year
ended December 31, 2010, our realized CASM was 12.09 cents,
an increase of 2.7 per cent from a CASM of 11.77 cents in the
prior year. Excluding fuel and employee profit share, our CASM
increased slightly to 8.52 cents, up 0.8 per cent from 2009.
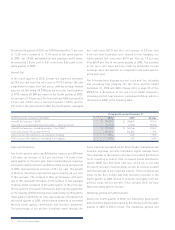
We maintained one of the strongest balance sheets in the North
American airline industry during 2010, as evidenced by our
significant cash and cash equivalents balance of $1,187.9 million
as at December 31, 2010, an increase of 18.2 per cent from
December 31, 2009. The increase in our cash position was a result
of our positive cash flow from operations. Our current ratio,
defined as current assets over current liabilities, improved
to 1.52 compared to 1.48 as at December 31, 2009, and our
adjusted debt-to-equity ratio improved by 2.8 per cent to 1.39
from 1.43 as at December 31, 2009. Similarly, our adjusted net
debt to earnings before interest, taxes, depreciation, aircraft rent
and other items (EBITDAR) ratio improved by 19.1 per cent to
1.78 compared to 2.20 as at December 31, 2009.
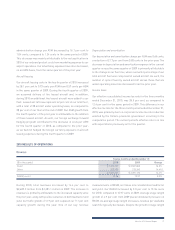
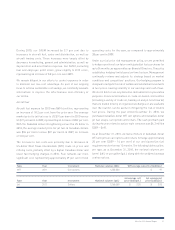
Our ROIC calculation is used to assess our efficiency at allocating
our capital to generate profitable returns. As at December 31,
2010, our trailing 12-month ROIC improved to 9.2 per cent from
7.8 per cent at December 31, 2009. This increase is primarily
attributable to improved earnings in 2010 versus 2009, and is
moving towards our target of a 12 per cent ROIC.
Operating cash flow for the year ended December 31, 2010, was
$443.3 million, an increase of 39.1 per cent from $318.7 million
in 2009. This increase is related primarily to improved earnings
from operations, as well as a positive year-over-year change in
non-cash working capital. Similarly, our diluted operating cash
flow per share increased to $3.05, as compared to $2.41 in 2009,
representing an increase of 26.6 per cent year over year.
During 2010, we increased our fleet size by five, ending the year
with 91 aircraft. With an average age of 5.2 years, we continue to
operate one of the youngest fleets of any large North American
commercial airline.
Quarterly load factor
84%
82%
80%
78%
76%
74%
72%
70%
Q1 Q2 Q3 Q4
2009
2010