Westjet 2010 Annual Report Download - page 23
Download and view the complete annual report
Please find page 23 of the 2010 Westjet annual report below. You can navigate through the pages in the report by either clicking on the pages listed below, or by using the keyword search tool below to find specific information within the annual report.-
 1
1 -
2
-
3
-
4
-
5
-
6
-
7
-
8
-
9
-
10
-
11
-
12
-
 13
13 -
 14
14 -
 15
15 -
 16
16 -
 17
17 -
 18
18 -
 19
19 -
 20
20 -
 21
21 -
 22
22 -
 23
23 -
 24
24 -
 25
25 -
 26
26 -
 27
27 -
 28
28 -
 29
29 -
 30
30 -
 31
31 -
 32
32 -
 33
33 -
34
-
35
-
36
-
37
-
38
-
39
-
40
-
41
-
42
-
43
-
44
-
45
-
46
-
47
-
48
-
49
-
50
-
51
-
52
-
53
-
54
-
55
-
56
-
57
-
58
-
59
-
60
-
61
-
62
-
63
-
64
-
65
-
66
-
67
-
68
-
69
-
70
-
71
-
72
-
73
-
74
-
75
-
76
-
77
-
78
-
79
-
80
-
81
-
82
-
83
-
84
-
85
-
86
-
87
-
88
-
89
-
90
-
91
-
92
-
93
-
94
-
95
-
96
-
97
-
98
 |
 |

WestJet 2010 Annual Report 21
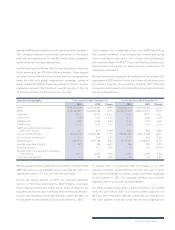
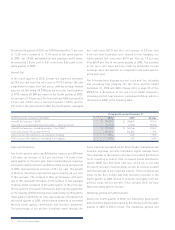
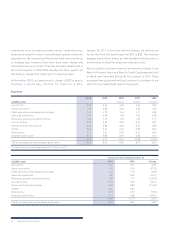
During 2010, our CASM increased by 2.7 per cent due to
increases in aircraft fuel, sales and distribution, as well as
aircraft leasing costs. These increases were largely offset by
decreases in marketing, general and administration, as well as
depreciation and amortization expense. Our CASM, excluding
fuel and employee profit share, grew slightly to 8.52 cents,
representing an increase of 0.8 per cent over 2009.
We remain diligent in our efforts to control expenses in order
to maintain our low-cost advantage. As part of our ongoing
focus to achieve sustainable cost savings, we constantly evaluate
alternatives to improve the effectiveness and efficiency of
our airline.
Aircraft fuel
Aircraft fuel expense for 2010 was $674.6 million, representing
an increase of 18.2 per cent from the prior year. The average
market price for jet fuel rose to US $91 per barrel in 2010 versus
US $71 per barrel in 2009, representing an increase of 28.2 per cent.
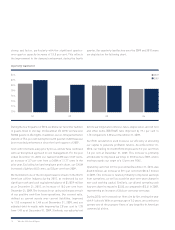
With the Canadian dollar strengthening versus the US dollar in
2010, the average market price for jet fuel in Canadian dollars
was $94 per barrel versus $81 per barrel in 2009, an increase
of 16.0 per cent.
The increase in fuel costs was primarily due to increases in
US-dollar West Texas Intermediate (WTI) crude oil prices and
refining costs, partially offset by a higher Canadian dollar and
lower fuel hedging charges in 2010. Fuel remains our most
significant cost, representing approximately 29 per cent of total
operating costs for the year, as compared to approximately
28 per cent in 2009.
Under our fuel price risk management policy, we are permitted
to hedge a portion of our future anticipated jet fuel purchases for
up to 36 months, as approved by our Board of Directors. The policy
establishes hedging limits based on time horizon. Management
continually reviews and adjusts its strategy based on market
conditions and competitors’ positions. Our hedging program is
designed to mitigate the risk of sudden and substantial movements
in fuel prices causing volatility in our earnings and cash flows.
We do not hold or use any derivative instruments for speculative
purposes. Financial derivatives in crude-oil-based commodities
(including a variety of crude oil, heating oil and jet benchmarks)
that are traded directly on organized exchanges or are available
over the counter, can be useful in mitigating the risk of volatile
fuel prices. During the year ended December 31, 2010, we
purchased Canadian-dollar WTI call options and Canadian-dollar
jet fuel swaps, call options and collars. The cash premium paid
during the year related to option-style contracts was $6.2 million
(2009 – $nil).
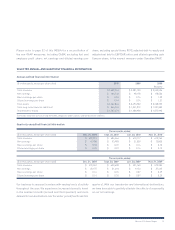
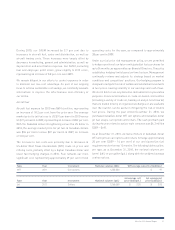
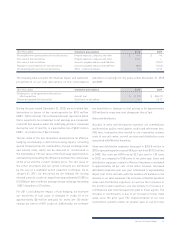
As at December 31, 2010, we had a mixture of Canadian-dollar
WTI and jet fuel call options and collars to hedge approximately
20 per cent (2009 – 14 per cent) of our anticipated jet fuel
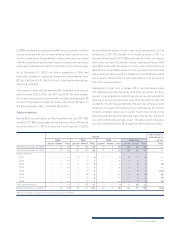
requirements for the next 12 months. The following tables outline,
per type, as at December 31, 2010, the notional volumes per
barrel (bbl.) or per gallon (gal.), along with the weighted average
contract prices.
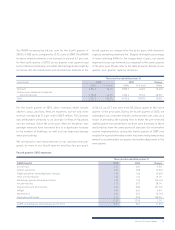
Type Year Instrument Notional volumes (bbl.) WTI average call price (CAD/bbl.)
WTI 2011 Call options 1,230,000 $ 97
Type Year Instrument Notional volumes (gal.)
Jet average call
price (CAD/gal.)
Jet average put
price (CAD/gal.)
Jet 2011 Collars 1,260,000 $ 2.50 $ 2.00