Westjet 2010 Annual Report Download - page 5
Download and view the complete annual report
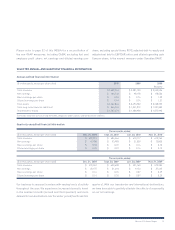
Please find page 5 of the 2010 Westjet annual report below. You can navigate through the pages in the report by either clicking on the pages listed below, or by using the keyword search tool below to find specific information within the annual report.-
 1
1 -
 2
2 -
 3
3 -
 4
4 -
 5
5 -
 6
6 -
 7
7 -
 8
8 -
 9
9 -
 10
10 -
 11
11 -
 12
12 -
 13
13 -
 14
14 -
 15
15 -
 16
16 -
17
-
18
-
19
-
20
-
21
-
22
-
23
-
24
-
25
-
26
-
27
-
28
-
29
-
30
-
31
-
32
-
33
-
34
-
35
-
36
-
37
-
38
-
39
-
40
-
41
-
42
-
43
-
44
-
45
-
46
-
47
-
48
-
49
-
50
-
51
-
52
-
53
-
54
-
55
-
56
-
57
-
58
-
59
-
60
-
61
-
62
-
63
-
64
-
65
-
66
-
67
-
68
-
69
-
70
-
71
-
72
-
73
-
74
-
75
-
76
-
77
-
78
-
79
-
80
-
81
-
82
-
83
-
84
-
85
-
86
-
87
-
88
-
89
-
90
-
91
-
92
-
93
-
94
-
95
-
96
-
97
-
98
 |
 |
WestJet 2010 Annual Report 3
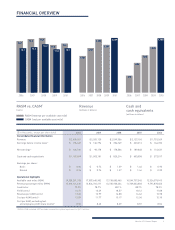
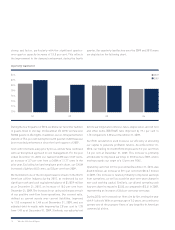
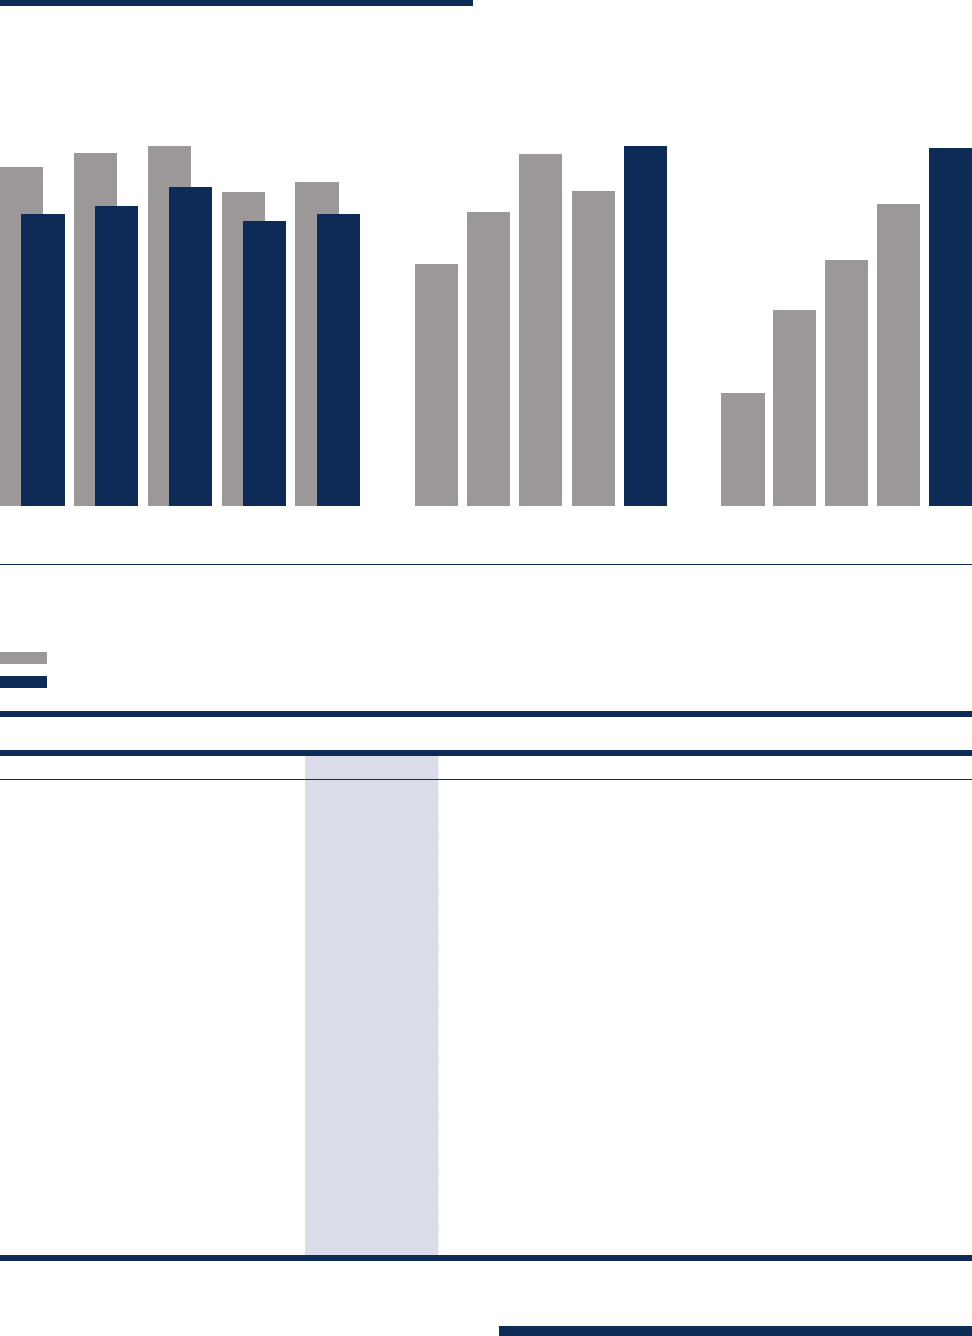
FINANCIAL OVERVIEW
RASM vs. CASM*
(cents)
RASM (revenue per available seat mile)
CASM (cost per available seat mile)
Revenue
(millions of dollars)
Cash and
cash equivalents
(millions of dollars)
2006 2007 2008 2009 2010
12.112.1 12.4
13.2
11.8
14.0 14.6 14.9
13.0 13.4
2006 2007 2008 2009 2010
378
654
820
1,005
1,188
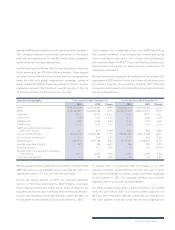
($ in thousands, except per share data) 2010 2009 2008 2007 2006
Consolidated fi nancial information
Revenue $ 2,609,261 $ 2,281,120 $ 2,549,506 $ 2,127,156 $ 1,751,269
Earnings before income taxes*$ 196,667 $ 136,796 $ 254,749 $ 233,313 $ 164,783
Net earnings* $ 136,720 $ 98,178 $ 178,506 $ 189,048 $ 116,631
Cash and cash equivalents $ 1,187,899 $ 1,005,181 $ 820,214 $ 653,558 $ 377,517
Earnings per share*
Basic $ 0.94 $ 0.74 $ 1.39 $ 1.46 $ 0.90
Diluted $ 0.94 $ 0.74 $ 1.37 $ 1.44 $ 0.90
Operational highlights
Available seat miles (ASM) 19,535,291,313 17,587,640,902 17,138,883,465 14,544,737,340 12,524,379,943
Revenue passenger miles (RPM) 15,613,121,610 13,834,761,211 13,730,960,234 11,739,063,003 9,791,878,403
Load factor 79.9% 78.7% 80.1% 80.7% 78.2%
Yield (cents) 16.71 16.49 18.57 18.12 17.88
Revenue per ASM (cents) 13.36 12.97 14.88 14.62 13.98
Cost per ASM (cents)* 12.09 11.77 13.17 12.36 12.10
Cost per ASM, excluding fuel
and employee profi t share (cents)*
8.52
8.45
8.29
8.57
8.54
*2006 to 2008 restated. 2007 excludes reservation system impairment of $31.9 million.
2006 2007 2008 2009 2010
1,751
2,127
2,550
2,281
2,609