Qantas 2015 Annual Report Download - page 87
Download and view the complete annual report
Please find page 87 of the 2015 Qantas annual report below. You can navigate through the pages in the report by either clicking on the pages listed below, or by using the keyword search tool below to find specific information within the annual report.-
 1
1 -
2
-
3
-
4
-
5
-
6
-
7
-
8
-
9
-
10
-
11
-
12
-
13
-
14
-
15
-
16
-
17
-
18
-
19
-
20
-
21
-
22
-
23
-
24
-
25
-
26
-
27
-
28
-
29
-
30
-
31
-
32
-
33
-
34
-
35
-
36
-
37
-
38
-
39
-
40
-
41
-
42
-
43
-
44
-
45
-
46
-
47
-
48
-
49
-
50
-
51
-
52
-
53
-
54
-
55
-
56
-
57
-
58
-
59
-
60
-
61
-
62
-
63
-
64
-
65
-
66
-
67
-
68
-
69
-
70
-
71
-
72
-
73
-
74
-
75
-
76
-
 77
77 -
 78
78 -
 79
79 -
 80
80 -
 81
81 -
 82
82 -
 83
83 -
 84
84 -
 85
85 -
 86
86 -
 87
87 -
 88
88 -
 89
89 -
 90
90 -
 91
91 -
 92
92 -
 93
93 -
 94
94 -
 95
95 -
 96
96 -
 97
97 -
98
-
99
-
100
-
101
-
102
-
103
-
104
-
105
-
106
 |
 |

NOTES TO THE FINANCIAL STATEMENTS CONTINUED
FOR THE YEAR ENDED 30 JUNE 2015
86
QANTAS ANNUAL REPORT 2015
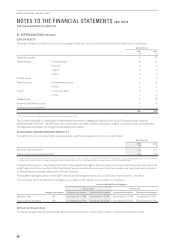
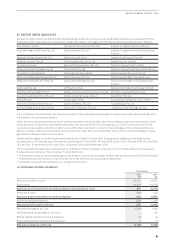
34. FINANCIAL RISK MANAGEMENT CONTINUED
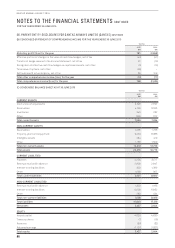
The table below sets out the maximum exposure to credit risk as at 30 June 2015:
Qantas Group
Notes
2015
$M
2014
$M
On Consolidated Balance Sheet
Cash and cash equivalents 10 2,908 3,001
Receivables 11 1,093 1,354
Other financial assets 26 662 206
The Qantas Group minimises the concentration of credit risk by undertaking transactions with a large number of customers and
counterparties in various countries in accordance with Board-approved policy. As at 30 June 2015, the credit risk of the Qantas
Group to counterparties in relation to other financial assets, cash and cash equivalents, and other financial liabilities amounted to
$2,963million (2014: $3,057 million). Refer to Note 26(B) for offsetting disclosures of contractual arrangements. The Qantas Group’s
credit exposure in relation to these assets is with counterparties that have a minimum credit rating of A-/A3, unless individually
approved by the Board.
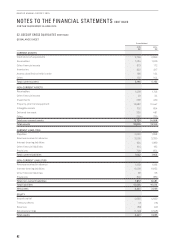
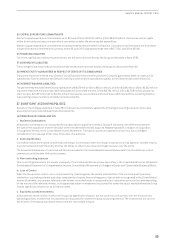
(D) FAIR VALUE
The fair value of cash, cash equivalents and non-interest-bearing financial assets and liabilities approximates their carrying value
due to their short maturity. The fair value of financial assets and liabilities is determined by valuing them at the present value of
future contracted cash flows. Cash flows are discounted using standard valuation techniques at the applicable market yield, having
regard to the timing of the cash flows.
The fair value of forward foreign exchange and fuel contracts is determined as the unrealised gain/loss at balance date by reference
to market exchange rates and fuel prices. The fair value of interest rate swaps is determined as the present value of future contracted
cash flows. Cash flows are discounted using standard valuation techniques at the applicable market yield, having regard to the timing
of the cash flows. The fair value of options is determined using standard valuation techniques.
Other financial assets and liabilities represent the fair value of derivative financial instruments recognised on the Consolidated
Balance Sheet in accordance with AASB 9. Refer to Note 37 for a definition of the fair value hierarchy.
2015 2014
Carrying Amount held at Carrying Amount held at
Notes
Fair Value through
profit and loss Amortised Cost Fair Value
Fair Value through
profit and loss Amortised Cost Fair Value
Financial assets
Cash and cash
equivalents 10 –2,908 2,917 –3,001 3,011
Receivables 11 –1,093 1,093 –1,354 1,354
Other financial assets126 662 –662 206 –206
Financial liabilities
Payables 19 –1,881 1,881 –1,851 1,851
Interest-bearing liabilities
21 –5,562 5,575 –6,483 6,392
Other financial liabilities126 484 –484 248 –248
1 Other financial assets and liabilities represent the fair value of derivative financial instruments recognised on the Consolidated Balance Sheet in accordance with AASB 9. These
derivative financial instruments have been measured at fair value using Level 2 inputs in estimating their fair values.
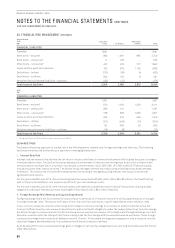
(E) CAPITAL MANAGEMENT
The Qantas Group’s capital management framework is designed to maximise shareholder value by targeting top quartile Total
Shareholder Return relative to the ASX100 and global airline peers. The framework’s key elements are to:
–Maintain an optimal capital structure commensurate with credit rating metrics1 between BBB and BBB-, which minimises cost of
capital, through holding an appropriate mix of debt (net debt including off balance sheet for aircraft operating leases) and equity
–Achieve Return on Invested Capital (ROIC) performance that exceeds cost of capital over the cycle. ROIC performance for the year
ended 30 June 2015 was 16.2 per cent (2014: (1.5) per cent)
–Grow Invested Capital over time via disciplined ROIC accretive investment, with flexibility to increase or decrease annual
investment levels as required. The Qantas Group’s average Invested Capital during the year ended 30 June 2015 was $9.1 billion
(2014: $13 billion)
1 Primary credit rating metrics are ‘Funds From Operations (FFO) to Debt’ and ‘Debt to EBITDA’ under Standard & Poor’s rating methodology and the equivalent ratios under Moody’s rating
methodology